
Figures & data
Figure 1. Images that were used as the CS (left) and GS (right).
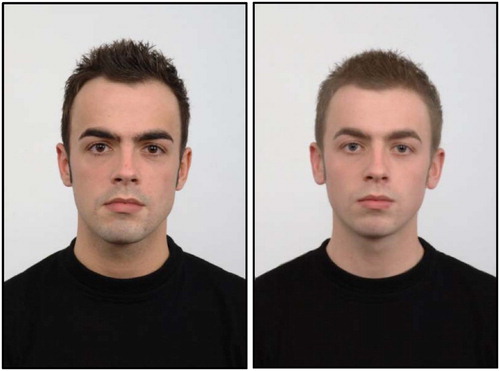
Figure 2. Experimental procedure.
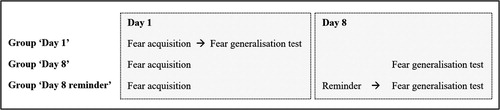
Table 1. Means (SD) for age, neuroticism, individually set shock intensity, and gender ratio.
Figure 3. Mean US-expectancy ratings during the acquisition (A1-12) and test phase (T1-T2). Error bars represent standard errors of the mean.
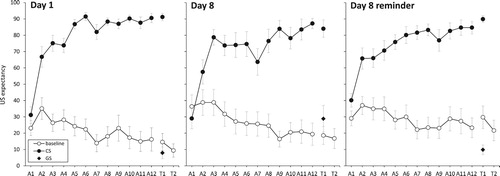
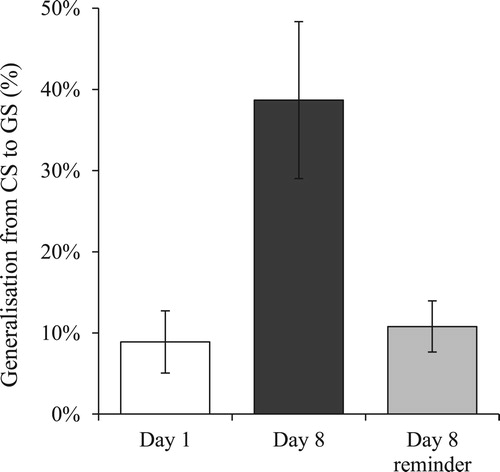
Figure 4. Generalisation indices (GIs), i.e. ratios GS:CS of ratings provided during the test phase. GIs reflect the percentage of generalisation from the CS to the GS. Error bars represent standard errors of the mean.
Supplemental material