Figures & data
Figure 1. Panel A – Participants’ self-reported emotions after exposure to the senders’ emotional displays. Scores range from 1 to 7 with higher scores indicating more intense self-reported emotion. Error bars represent standard errors of the mean. Panel B – Evaluations of the senders’ social characteristics as a function of their emotional displays. Scores range from 1 to 7, with higher scores indicating more favourable evaluations. Error bars represent standard errors of the mean. Panel C – Facial EMG scores for zygomaticus, corrugator and depressor muscles as a function of the senders’ emotional displays. The upper plot shows mean changes for a 35-second stimuli presentation with error bars representing standard errors of the mean. Bottom plots show mean signal across stimuli presentation time.
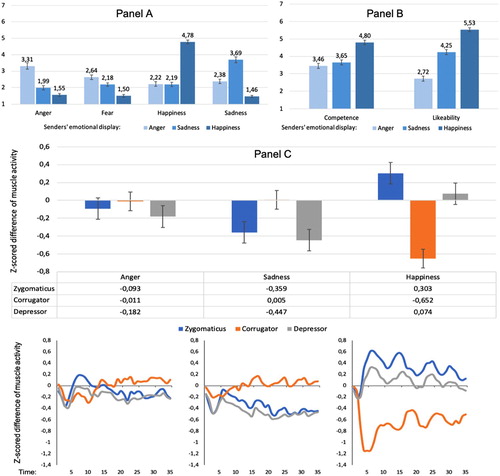
Table 1. Mediational and indirect effects of the relationship between the sender’s emotional display and the receivers’ self-reported emotions through facial muscle activation: Estimates of fixed effects (paths a, b and c’) and indirect effects with 95% confidence intervals (computed using 10,000 Monte Carlo simulation).
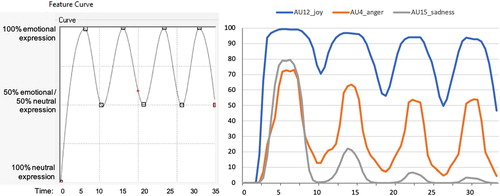
Figure A1. The left panel shows the exact morphing sequence for a 35-second stimulus. The right panel shows mean AFFDEX Emotion Channels scores for the displayed emotions as detected by iMotion software.