Figures & data
Figure 1. Overview of a congruent trial (left) and an incongruent trial (right) in Experiment 1.
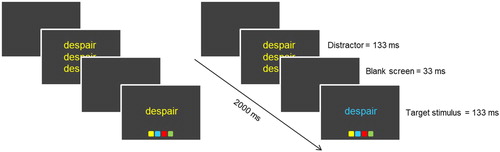
Table 1. Mean scores and standard deviations of valence, arousal, concreteness, frequency and number of letters of each word group.
Table 2. Behavioral data of Experiment 1 (N = 55).
Figure 2. Reaction times as a function of previous congruency (x-axis) and current congruency (lines) for neutral (left) and emotional (right) previous-trial words. The error bars indicate the 95% confidence intervals of the between-subject standard errors.
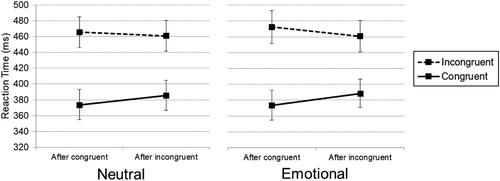
Table 3. Behavioral data of Experiment 2 of self-related blocks (N = 54).
Table 4. Behavioral data of Experiment 2 of sender-related blocks (N = 54).
Figure 3. Reaction times as a function of previous congruency (x-axis) and current congruency (lines) for neutral (left panels) and emotional (right panels) previous-trial words, separate for self-related blocks (top panels) and sender-related blocks (bottom panels). The error bars indicate the 95% confidence intervals of the between-subject standard errors.
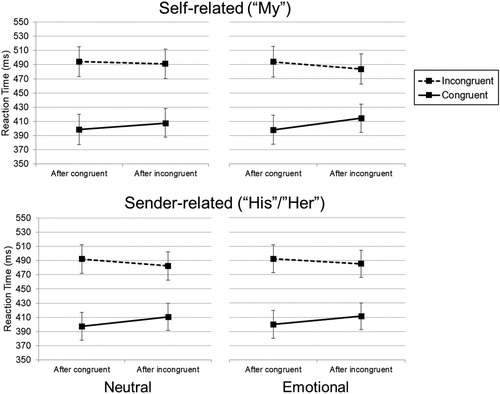
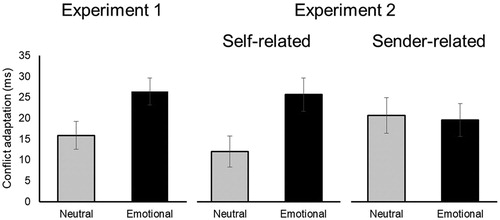
Figure 4. Conflict adaptation effects measured in RT (ms) after neutral and emotional previous-trial words, separate per experiment and levels of relevance. Error bars represent standard errors of the within-subject conflict adaptation effects (difference score).