
Figures & data
Table 1. Experimental stimuli.
Figure 1. Three representations of the same laugh: mel-scaled auditory spectrogram (A), modulation spectrum (B), and self-similarity matrix (C). SSM's lower panel shows the novelty contour (dotted black line) over the input spectrogram.
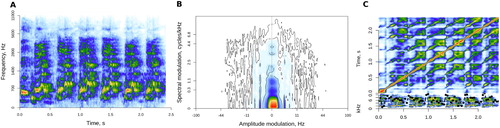
Figure 2. An example sequence with six target digits (715296) and a distractor (laugh) from the short-term memory experiment designed to obtain an implicit measure of salience. Spectrograms of left and right stereo channels with 25 ms Gaussian windows and 50% overlap.
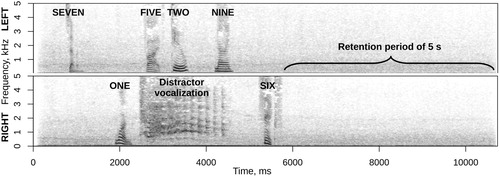
Figure 3. Perceived intensity of emotion and self-reported salience of experimental stimuli. Light-gray ellipses mark the position of individual sounds (labelled 1 through 128) with two-dimensional 95% CIs. Solid lines show the relation between intensity and salience within each emotion class predicted with multilevel beta-regression, with shaded 95% CIs.
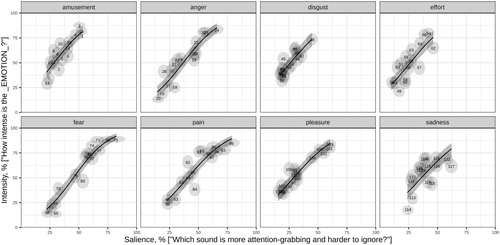
Figure 4. Extra errors attributable to the presence of a distractor vocalisation as a function of its self-reported salience. Light-gray ellipses mark the position of individual sounds (N = 64) with two-dimensional 95% CIs. The solid regression line shows the best fit with shaded 95% CI. The dotted line marks OR = 1 (as many errors as without any distractors). am = amusement, an = anger, ds = disgust, ef = effort, fr = fear, pn = pain, pl = pleasure, sd = sadness.
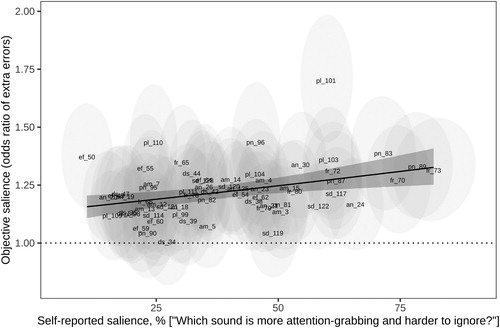
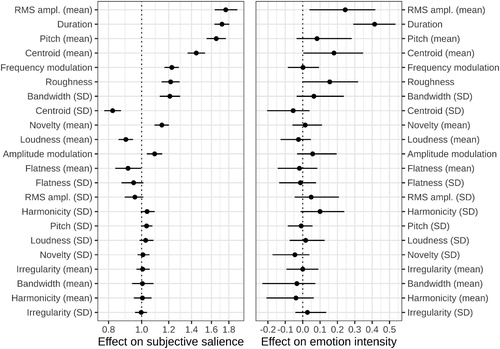
Figure 5. Acoustic predictors of self-reported salience (left panel; odds scale, i.e. no effect = 1) and emotion intensity (right panel; linear scale, i.e. no effect = 0). Beta-coefficients from multiple regression showing the effect of a 1 SD difference in each acoustic characteristic, with 95% CI. Mirroring the design of the two experiments, acoustic predictors were normalised across all sounds for salience and within emotion category for intensity; the magnitude of effects is directly comparable within each panel.
Data availability statement
All materials for running the experiments (HTML, audio stimuli, etc.), datasets of responses, and scripts for statistical analysis can be downloaded from http://cogsci.se/publications.html.