
Figures & data
Figure 1. Schematic overview of the five studies, showing the experimental manipulations, the intergroup game, the study platform, and the actors used in each study.
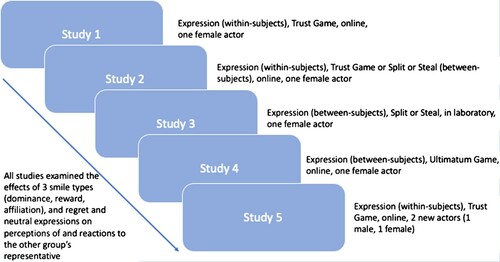
Figure 2. Still frames illustrating the dynamic facial expression stimuli (Studies 1-4): The three smile types, neutral, and regret expressions displayed by the other group’s representative following an uncooperative decision.
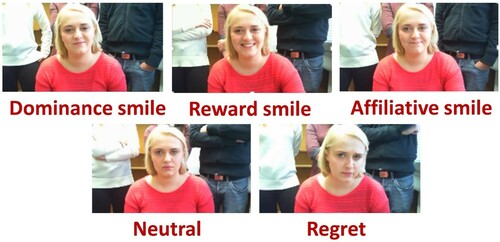
Table 1. Descriptive statistics for the main dependent variables.
Table 2. Summary of the findings.
Figure 3. Key dependent measures for Studies 1-5. Bars show average values across studies, while data points show individual study values. Error bars denote standard deviations. For ease of comparison in this figure, Study 4 measures were converted to 7-point scales.
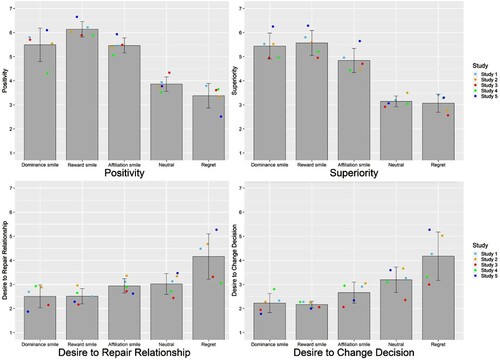
Table 3. Summary of correlations between the indices of trust and social motives communicated by the other group’s representative in Studies 1-4.
Supplementary_Material
Download MS Word (143.3 KB)Data availability statement
Supporting data will be openly available at https://osf.io/n82s9/.
Acknowledgements
The authors thank Ruth Lee and Gary McKeown for their help with ggplot2.