Figures & data
Table 1. Demographic characteristics of participants in the happy music, sad music, and white noise groups.
Figure 1. Process of the experimental programme.
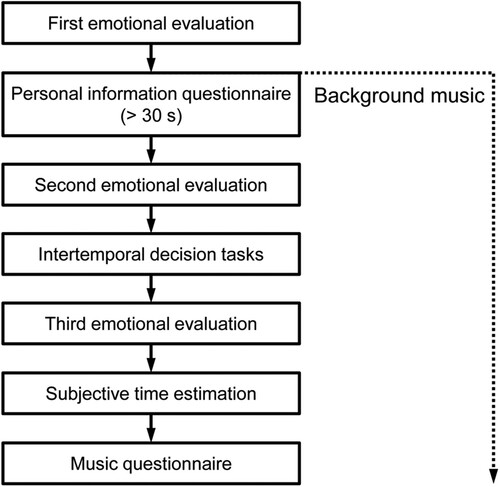
Figure 2. Group differences of the rating scores in the three evaluations of emotions (happy–sad), arousal, and mood. * p < .05; ** p < .01; *** p < .001. Error bars indicate SE.
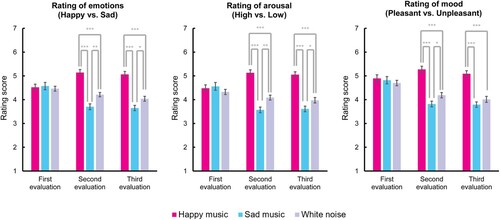
Figure 3. Mean discount factors for the three groups in the intertemporal decision tasks under money-gain and -loss conditions. The greater the discount factor, the more likely people prefer LL. * p < .05; ** p < .01; *** p < .001. Error bars indicate SE.
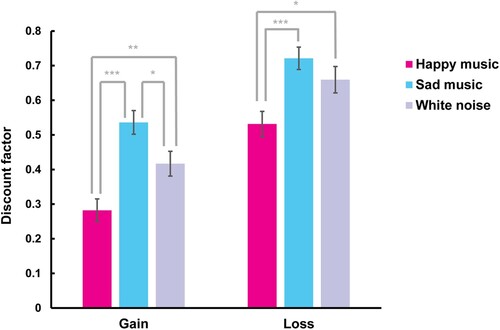
Figure 4. Multicategorical mediation model for happy and sad music on the discount factor in the money-gain intertemporal decision task (unstandardised beta reported). * p < .05; ** p < .01; *** p < .001.
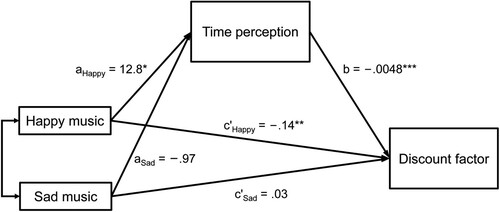
Table 2. Demographic characteristics of participants in the fast and slow tempo groups.
Figure 5. Mean rating scores in the three evaluations of emotions (happy/sad), arousal, and mood for the fast and slow tempo groups. ** p < 0.01; *** p < 0.001. Error bars indicate SE.
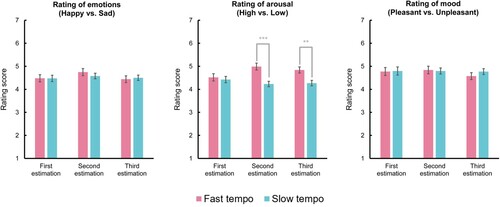
Figure 6. Mean discount factor for the fast and slow tempo groups in the intertemporal decision-making tasks under money-gain and -loss conditions, respectively. ** p < 0.01. Error bars indicate SE.
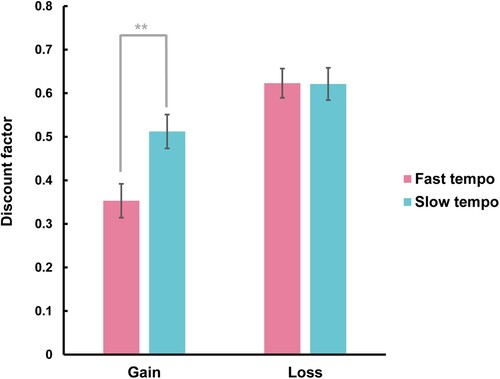
Figure 7. Mediation model for music tempo on the discount factor in the intertemporal decision task under money-gain conditions (unstandardised beta reported). ∼ p < .1; ** p < .01; *** p < .001.
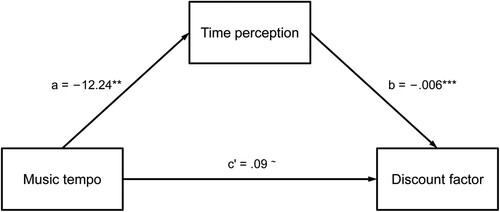
Table 3. Demographic characteristics of participants in the major and minor music groups.
Figure 8. Mean rating scores in the three evaluations of emotions (happy/sad), arousal, and mood for the major and minor groups. ** p < .01. Error bars indicate SE.
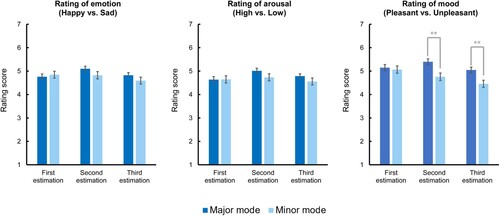
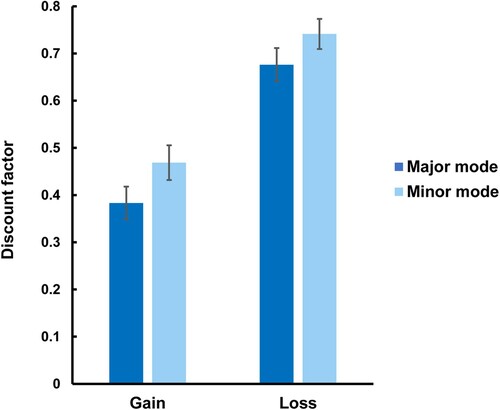
Figure 9. Mean discount factor for the major and minor groups in the intertemporal decision tasks under money-gain and -loss conditions, respectively. Error bars indicate SE.