
Figures & data
Table 1. Descriptive statistics of measures at t1 and t2 by gender.
Figure 1. An illustration of a latent state model (longitudinal confirmatory factor model) for construct X with three indicators and two measurement points (A), a latent change model for construct X (B), and a bivariate latent change model for constructs X and Y with a predictor and an outcome (C). Factor loadings (λ) and intercepts are set to be invariant within constructs and over time in all models. Dashed lines represent latent correlations. Correlated residuals between respective items across the measurement points omitted for the sake of clarity.
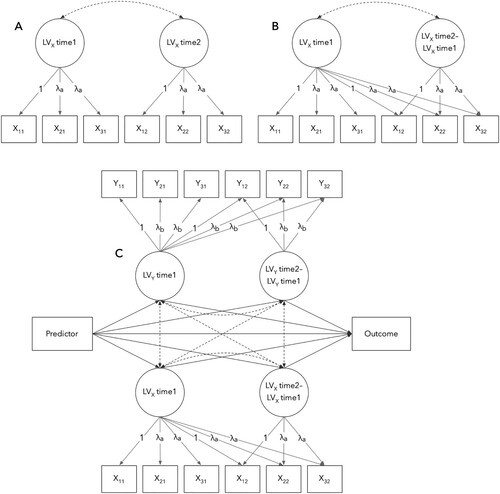
Table 2. Correlation matrix of variables at t1 and t2.
Table 3. Descriptive statistics and latent correlations from the latent state model.
Table 4. Descriptive statistics and latent correlations from the latent change model.
Figure 2. Summary of main results from the multivariate latent change model with gender as a predictor and math performance as an outcome. For clarity, only effects and correlations at p < .05 (solid lines) and p < .10 (dashed lines) are displayed (along with unstandardised factor loadings).
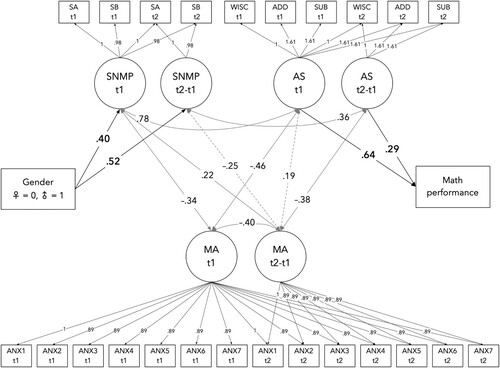
Table 5. Predictive effects from the bivariate latent change model with gender as predictor and maths performance as an outcome.
Table A1. Overview of the studies (n = 27) of the relations between children’s (6–8 y.o.) mathematics anxiety and mathematics performance.
Supplementary_Material
Download Zip (39.1 KB)Data availability statement
The data are available upon request from the correspondent author.