Figures & data
Figure 1 . Illustration of the sequence of the trials in the learning task (a) and the stimuli presented on the visual search display (b). In the learning task (a), participants were required to choose one of the faces in each pair to maximise their earnings. In the visual search task (b), participants were required to identify one discrepant face embedded among distractor faces (Figure (b) illustrates the search display for the target-present condition). The faces were not covered with eye masks in the actual experiment.
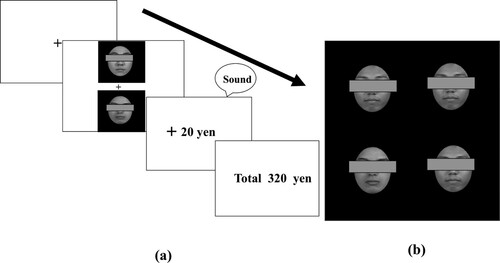
Figure 2. Mean (± standard error) proportion of target face selection for each block in the reward, punishment, and zero-outcome conditions in Experiment 1.
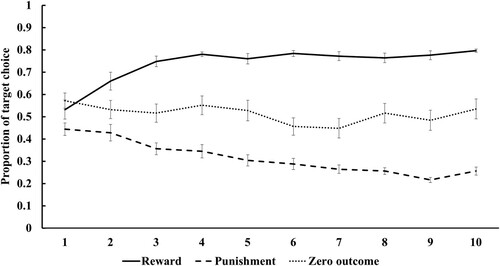
Figure 3. Mean (± standard error) reaction times (RTs) for the detection of neutral faces associated with reward, punishment, and zero outcome. Asterisks denote significant differences between conditions (*p < .05; n.s.: not significant).
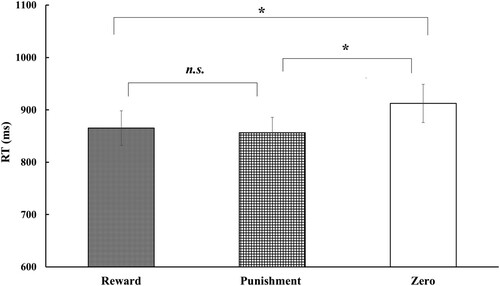
Figure 4. Mean (± standard error) proportion of target face selection for each block in the reward, punishment, and zero-outcome conditions in Experiment 2.
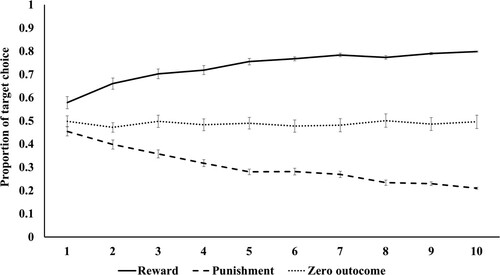
Figure 5. Mean (± standard error) RTs for the detection of high- and low-probability faces in the reward and punishment conditions for successful learners. Asterisks represent, as a whole, a significant main effect of the assigned value probability (*p < .05.).
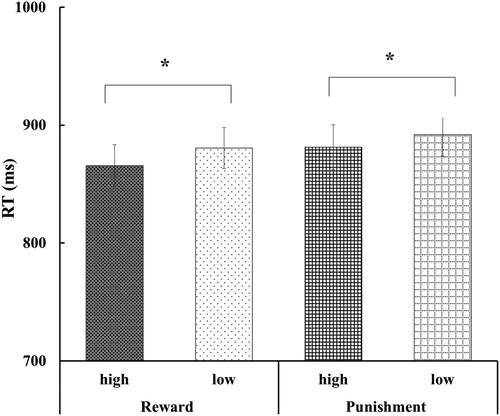
Table 1. Mean scores (with standard error) of subjective ratings of valence and arousal for 71 participants.
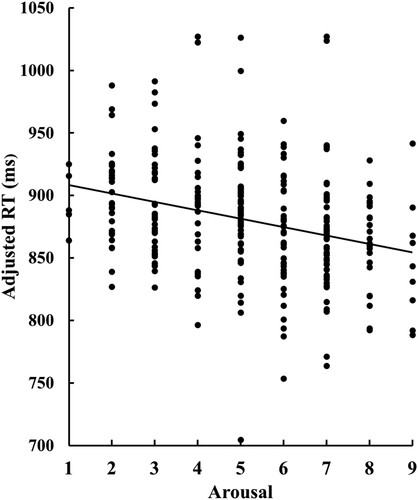
Figure 6. Scatter plot and regression line demonstrating the significant relationship between visual search performance (adjusted RTs) and arousal ratings.