Figures & data
Figure 1. Example of stimuli used for the adaptation experiments. (A) Neutral expression, (B) Happy expression, genuine and faked, (C) Angry expression, genuine and faked.
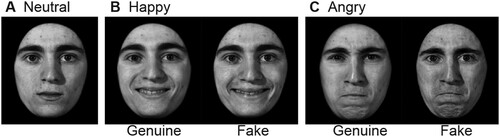
Figure 2. Expressive intensity matching task. Illustration of a single trial. Top face displays a faked expression of happiness at maximum intensity (100%). Bottom images represent morphs ranging from 60% Happiness and 40% Neutral (1) to 100% Happiness and 0% Neutral (5), in steps of 10%. Participants had to select the face from the bottom row that matched the top row face in expressive intensity.
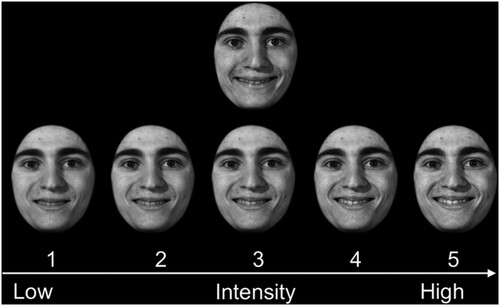
Figure 3. Mean (± 1SEM) similarity in low-level properties between neutral and genuine expressions (Genuine) and between neutral and fake expressions (Fake), n.s. p > 0.05.
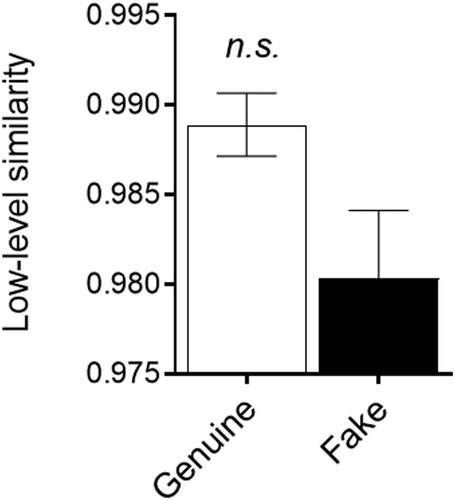
Table 1. Presence and intensity of AUs.
Figure 4. Illustrations of single trials of (A) the pre-adaption phase and (B) the adaptation phase.
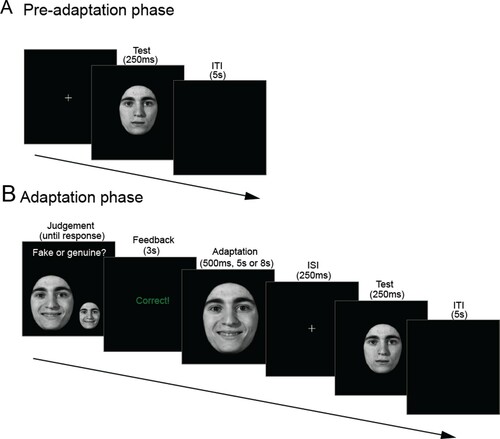
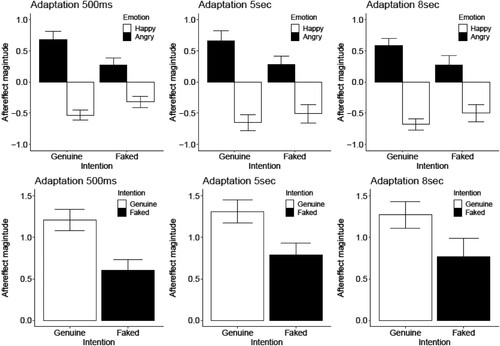
Figure 5. Adaptation aftereffects. Top panels: Aftereffect magnitude following happy and angry adaptation. Aftereffects were calculated by subtracting the ratings of the test face obtained in the pre-adaptation phase from those following the happy and angry adaptation phase for the experiments with 500 ms, 5 and 8 s duration adaptations (from left to right). Here positive values indicate that the test face appeared happier, while negative values indicate that the test face appeared angrier. Bottom panels: For illustrative purposes, difference between happy and angry aftereffects are shown for the Genuine and Faked conditions. Aftereffects were calculated by subtracting the ratings of the test face following angry adaptation from ratings of the test face following happy adaptation directly. Here positive values indicate typical, repulsive aftereffects where the test stimulus appears less like the adapting stimulus. Error bars indicate SEM.