Figures & data
Figure 1. The figure shows the extent to which the quadratic (V-shaped; solid line) and the linear models (dashed line) explain the relationship between valence and arousal in the core affect (CA; panel A) and in the perception of affective quality (PAQ; panel B) of study 1. Panel C (CA condition) and D (PAQ condition) represent the valence-arousal relationship in study 2.
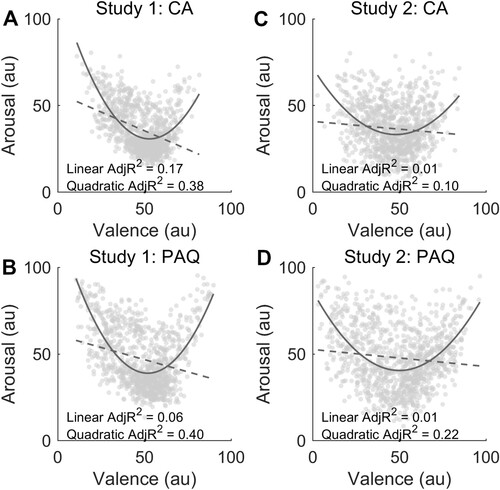
Figure 2. The figure shows the goodness of fit of the linear and quadratic (V-shaped) models after equating the number of vocal bursts over emotion categories with random selection (n = 1,000 iterations). In panels A, C, E, and G, each dot represents the adjusted R2 coefficient of the V-shaped (dark grey) and linear (light grey) models for a random selection of 168 vocal bursts (21 emotion categories, 8 stimuli per category). In panels B, D, F, and H, histograms show the distribution of the difference between the two models. The dark grey dot and line represent the average difference and standard deviation across the 1,000 random iterations.
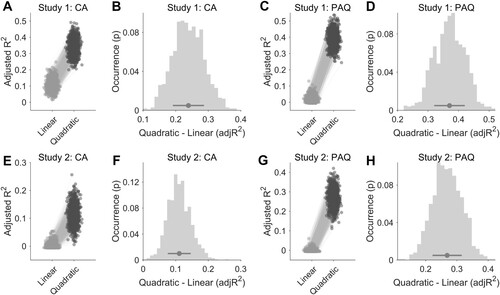
Figure 3. Panels A and C show the association between valence ratings collected across the two studies under the CA and PAQ conditions, respectively. The similarity in arousal scores collected between the studies is represented in panel B for the CA condition and D for the PAQ condition. Solid lines represent linear regression lines. Dashed lines express the perfect correspondence between study 1 and study 2 ratings.
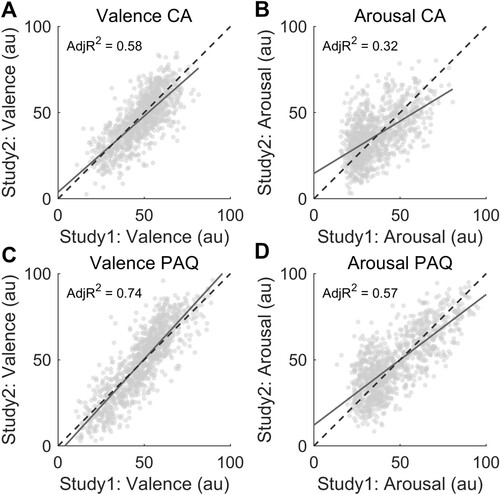
Figure 4. This figure shows the results for the generalised linear mixed-effects model analysis (study 2; Poisson distribution, log link function, fit method: maximum likelihood using Laplace approximation). Panel A depicts the relationship between arousal scores observed in the CA condition and those predicted based on the squared version of CA valence ratings (formula D in the main text). Panel B shows the same association in PAQ data. Dashed lines represent perfect predictions.
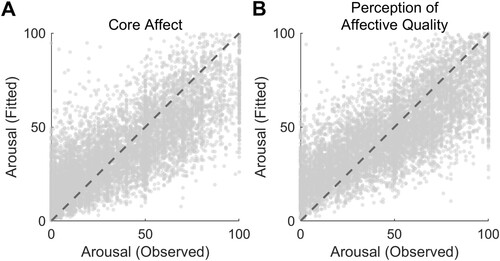
Figure 5. This figure summarises the linear relationship between core affect and perception of affective quality ratings of valence (panel A, C) and arousal (panel B, D) across the two studies (study 1 top row, study 2 bottom row).
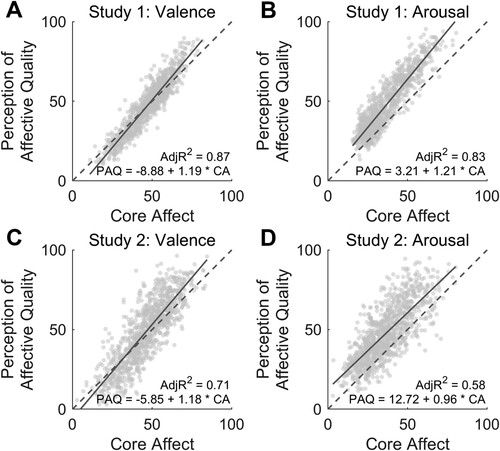
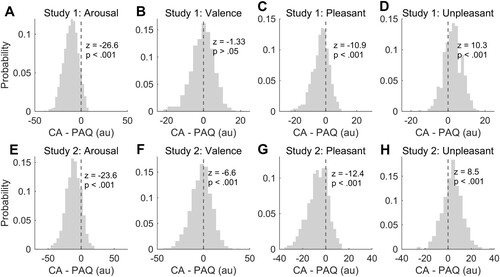
Figure 6. This figure summarises the differences between core affect (CA) and perception of affective quality (PAQ) as a function of arousal (panel A and E), valence (panel B and F), pleasantness (panel C and G), and unpleasantness (panel D and H) of vocal bursts. Arousal, pleasantness, and unpleasantness ratings were more extreme for the PAQ rather than for the CA condition across the two studies. A significant shift in the neutral point was observed in study 2 (panel F) but not in study 1 (panel B).