Figures & data
Figure 1. Diagram to illustrate our cognitive model of emotion recognition in music. Note. Reprinted from MacGregor and Müllensiefen (Citation2019). Grey rectangles indicate covert processes that cannot easily be directly measured or controlled, while the grey parallelograms represent readily observable processes. The contribution of individual differences in various latent variables are represented by yellow circles, and purple diamonds represent underlying cognitive mechanisms.
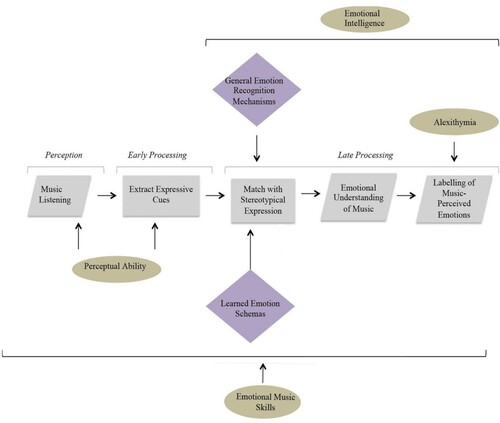
Figure 2. A model outlining the processing of emotions in speech prosody. Note. Reprinted with permission from Schirmer and Kotz (Citation2006). The first box on the left represents the earliest stage of processing (0–100 ms), which recruits auditory perceptual systems. The next stage of processing (200 ms) involves integration of acoustic cues of emotion from speech prosody. The third stage (400 ms) permits an understanding of the stimulus via the engagement of higher cognitive processes. A similar process is hypothesised to underlie the processing of emotion in music.
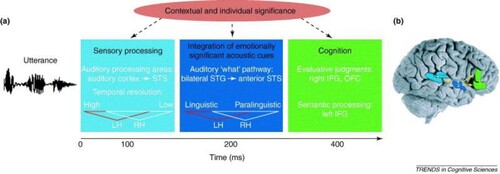
Table 1. Combinations of item variables that contributed to low accuracy.
Figure 3. Visualisation of the contributions of the item features emotion combination, instrument and melody to response accuracy at each parameter level. Note. For each of the emotion combination parameters in graph A, the former emotion is the target emotion and the latter the comparison emotion. Error bars represent the lower and upper confidence interval.
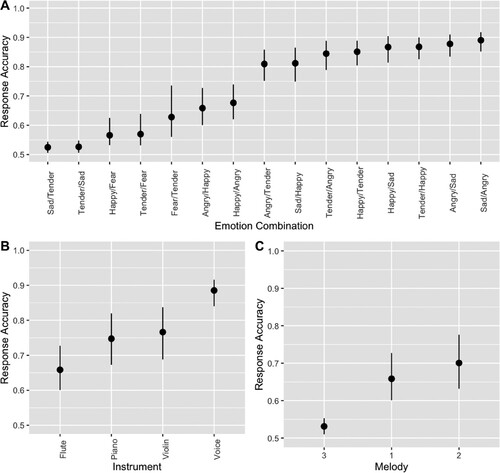
Table 2. Parameter estimates from the Bayesian mixed effects model.
Table 3. Contributions of item features to response accuracy at each parameter level.
Figure 4. Correlations between true scores and final ability estimates in test simulations of different lengths. Note. Test Length is represented by number of items. Correlation represents Pearson’s Correlation Coefficient statistic (r). Error bars represent standard error of the correlation coefficient.
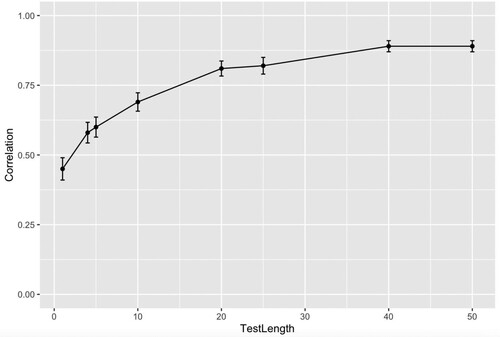
Figure 5. Empirical distribution of ability estimates in the current sample. Note. N > = 89.
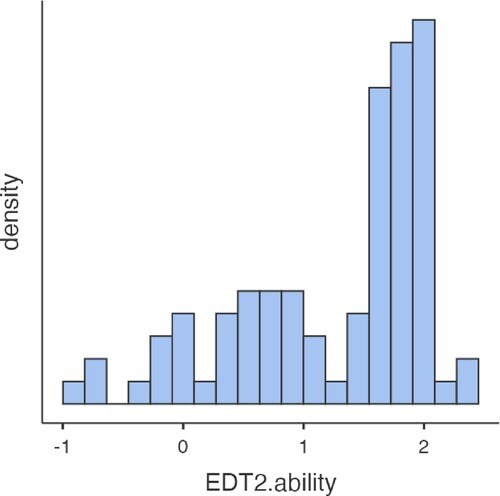
Figure 6. Standard error mean (SEM) of BM ability estimates by test length.
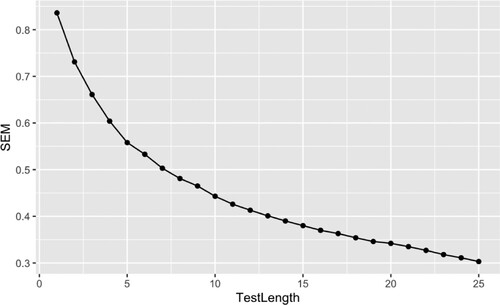
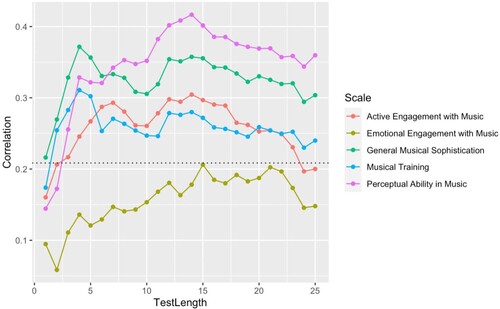
Figure 7. Correlations between test length and scores on measures of related constructs. Note. Dotted line represents the alpha level of p > = .05, calculated based on the correlation with the lowest sample size (ERI Vocal recognition: n > = 68).
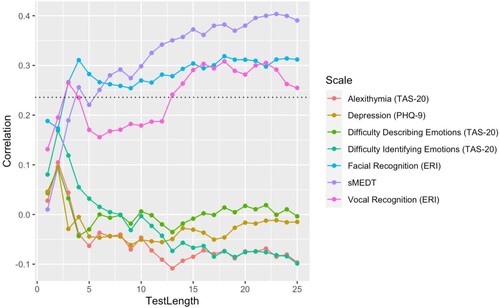
Figure 8. Correlations between test length and scores on the Goldsmiths Musical Sophistication Index. Note. Dotted line represents alpha level (n > = 89).