
Figures & data
Figure 1. Example of nostalgic versus control pictures.
Note. Left image illustrates a nostalgic picture. Right image illustrates a control picture.

Figure 2. Virtual maze presentation from participants’ perspective.
Note. Participants’ perspective of the maze including a neutral wall-mounted image functioning as a local landmark, with a distal landmark located beyond the maze, and a directional arrow positioned at a junction.
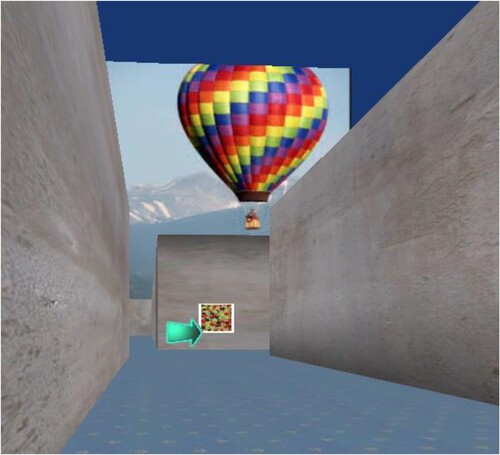
Figure 3. Route layout for the baseline and experimental maze in Experiment 1.
Note. Schematic of the baseline maze (A) and experimental maze (B) including layout, route, and landmark positions. The red arrows illustrate the specified route and the green box indicates the end destination. The blue circles mark the position of neutral distal landmarks. The orange triangles indicate the position of the neutral/nostalgic/control local landmarks.
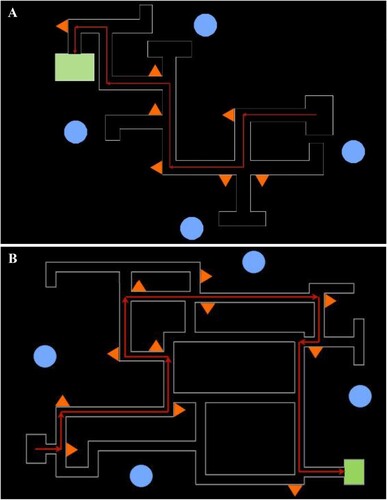
Figure 4. Mean (±SEM) latencies for the baseline and experimental maze test trials in Experiment 1.
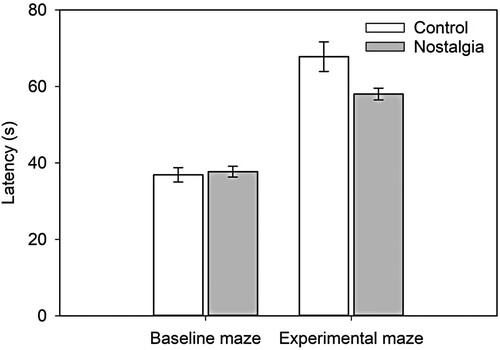
Figure 5. Route layout for Maze 1 and Maze 2 in Experiment 2.
Note. Schematic of Maze 1 (A) and Maze 2 (B) layout, route, and landmark positions. The red arrows illustrate the specified route and the green box indicates the end destination. The large blue circles mark the position of neutral distal landmarks. The small blue circles indicate the position of neutral local landmarks. The orange triangles indicate the position of nostalgic/control local landmarks.
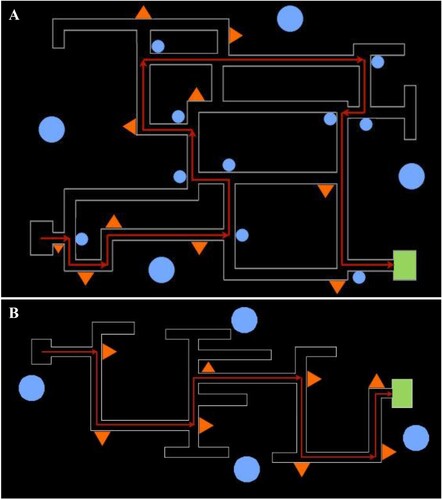
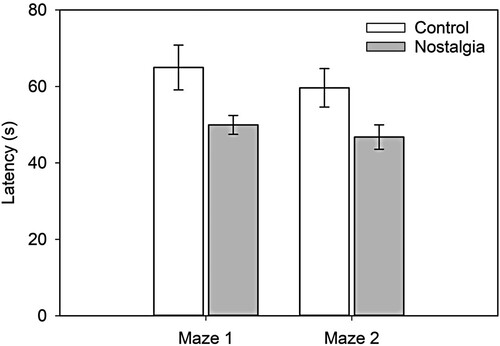
Figure 6. Mean (±SEM) latencies for the route-learning tasks in Experiment 2.
Data availability statement
The data that support the findings of this study are available from the corresponding author, ESR, upon reasonable request.