Figures & data
Table 1. Three instruction conditions.
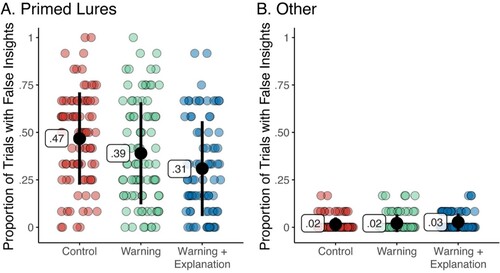
Figure 1. Proportion of Trials With False Insights Reported in Each Instruction Condition for each Anagram Type. Note. Data points illustrate the proportion of trials with false insights recorded for each participant. Means and standard deviations are shown in black.