Figures & data
Figure 1. The figure shows the experimental sequence in the prime-probe task. Each panel shows a trial and each smaller panel shows a stimulus screen, where the three word screen is a prime stimulus and the one word screen is the probe stimulus.
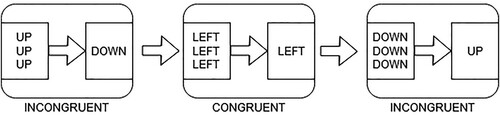
Figure 2. The figure shows the experimental sequence in the flanker task. Each panel shows a trial where the middle letter is the target stimulus, and the flanking letters are the distractors.
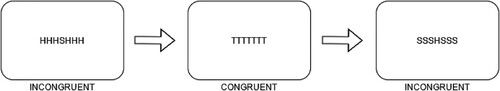
Figure 3. The figure shows the mean reaction time broken down by the congruency of the current and the previous trials for the prime – probe control experiment. The Y-axis shows the mean RTs in ms. The X axis shows the congruency of the previous trial. The legend shows the congruency of the current trial. Error bars represent the standard error.
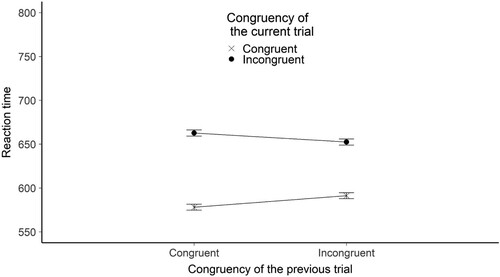
Figure 4. The figure shows the mean reaction time broken down by the congruency of the current and the previous trials for the flanker control experiment. The Y-axis shows the mean RTs in ms. The X axis shows the congruency of the previous trial. The legend shows the congruency of the current trial. Error bars represent the standard error.
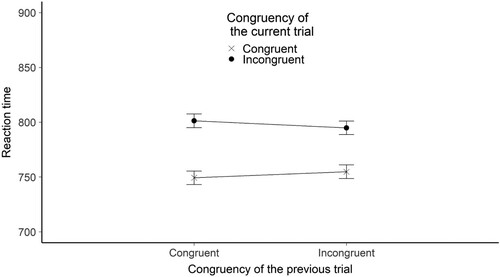
Table 1. Total participant number before and after exclusions median age and female percentage in the critical experiment.
Figure 5. The figure shows the experimental sequence in the affective prime-probe task. First a blank screen, then an affective word trial, and finally a prime-probe trial. Each panel shows a trial and each smaller panel shows a stimulus screen, where the three word screen is a prime stimulus and the one word screen is the probe stimulus.
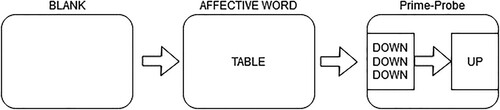
Figure 6. The figure shows the mean reaction time broken down by the congruency of the current trial and the valence of the previous word stimulus for the prime – probe valence experiment. The Y-axis shows the mean RTs in ms. The X axis shows the valence of the previous word. The legend shows the congruency of the current trial. Error bars represent the standard error.
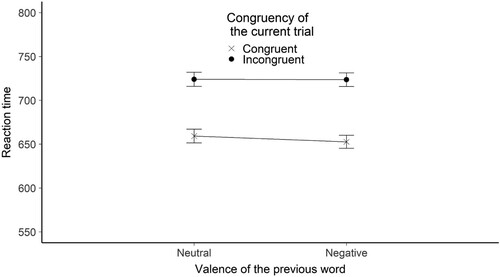
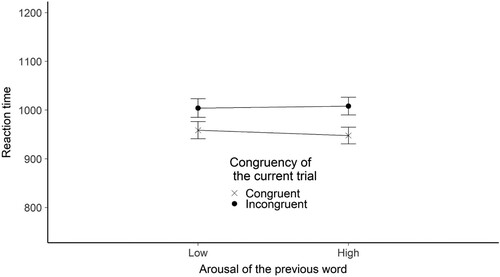
Figure 7. The figure shows the mean reaction time broken down by the congruency of the current trial and the arousal of the previous word stimulus for the prime – probe arousal experiment. The Y-axis shows the mean RTs in ms. The X axis shows the arousal of the previous word. The legend shows the congruency of the current trial. Error bars represent the standard error.
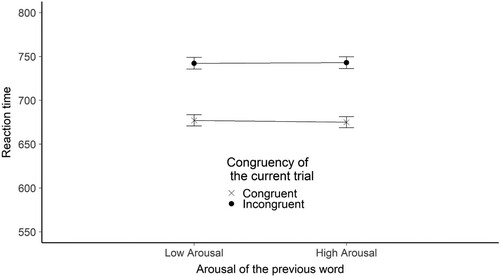
Figure 8. The figure shows the experimental sequence in the affective flanker task. First a blank screen, then an affective word trial, and finally a flanker trial. Each panel shows a trial.
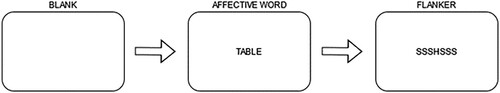
Figure 9. The figure shows the mean reaction time broken down by the congruency of the current trial and the valence of the previous word stimulus for the flanker valence experiment. The Y-axis shows the mean RTs in ms. The X axis shows the valence of the previous word. The legend shows the congruency of the current trial. Error bars represent the standard error.
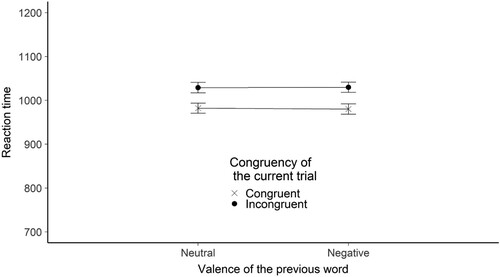
Figure 10. The figure shows the mean reaction time broken down by the congruency of the current trial and the arousal of the previous word stimulus for the flanker valence experiment. The Y-axis shows the mean RTs in ms. The X axis shows the arousal of the previous word. The legend shows the congruency of the current trial. Error bars represent the standard error.