
Figures & data
Figure 1. (a) Scree plot graphing of eigenvalues of parallel analysis for the 17 final components of Study 1; (given minimum residual solution for 500 simulated analyses, .50 for added observation per cell and with eigenvalues compared against the matching 95% quantile of the simulated data). (b) Scree plot graphing of eigenvalues of parallel analysis for the 10 final components of Study 1 (given minimum residual solution for 500 simulated analyses, .50 for added observation per cell and with eigenvalues compared against the matching 95% quantile of the simulated data).
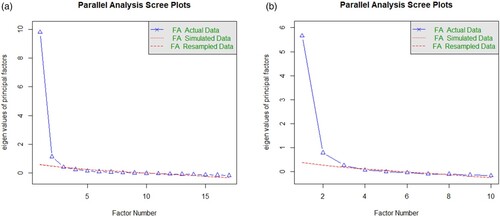
Table 1. Results from an exploratory factor analysis of the Geneva Sentimentality Scale (Study 1)
Table 2. Correlations between GSS scores and participants’ scores to the various subscales of the DPES.
Table 3. Results from a confirmatory factor analysis of the Geneva Sentimentality Scale (GSS).
Table 4. Means, standards deviations, skewness, kurtosis and bivariate correlations for the GSS (Study 2).
Table 5. Zero-order correlations between participants’ emotional reactions towards the three video clips (Y-axis) and their emotional dispositions (X-axis) as measured through the GSS, the KAMF, the single-item measure, and the seven subscales of the DPES (Study 2).
Table 6. Correlations between participants’ attitudes and behaviours and various emotional disposition scales (GSS, KAMF, Awe, and Amusement).
Table 7. Correlations between GSS scores and participants’ scores to the other emotion scales (Studies 3 and 5). Correlations for Study 3 are displayed above the diagonal in bold and correlations for Study 5 below. The diagonal (in italics) displays Cronbach’s alphas for Studies 3 and 5.
Table 8. Zero-order correlations between participants’ emotional states during the past week (rows) and their emotional dispositions (columns) as measured through the GSS, the KAMF, the Gratitude Questionnaire and the seven subscales of the DPES.
Table 9. Results from a confirmatory factor analysis of the Geneva Sentimentality Scale (Study 5).
Table 10. Zero-order correlations between participants’ emotional states during the past week (rows) and their emotional dispositions (columns) as measured through the GSS, the KAMF, the single-item measure, the Gratitude Questionnaire and the seven subscales of the DPES (Study 5).
GSS_R2_SupplementaryMaterials.docx
Download MS Word (340 KB)Data availability statement
All materials, data and analysis scripts are publicly available on OSF at https://osf.io/7gepq/ (DOI 10.17605/OSF.IO/7GEPQ)