
Figures & data
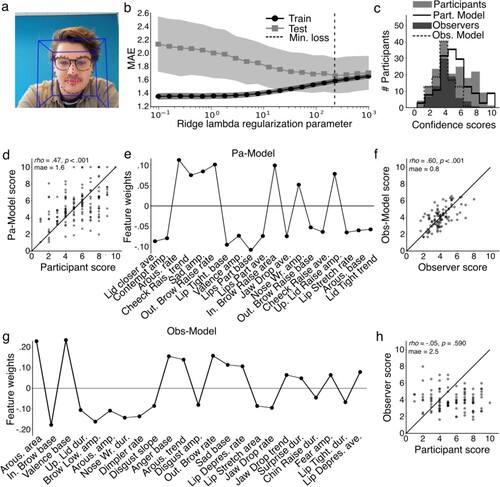
Figure 1. Procedure, analysis and results. a, Example image of a video frame of author M.K. recorded with a webcam and processed by OpenFace. b, Mean absolute error as a function of lambda hyper-parameter (small lambdas typically result in overfits with bad test as compared to train results; large lambdas result in underfit). The optimum lambda is the point where test results are best (lowest MAE) and do not differ much from training results. c, Histogram of nervousness scores determined per party (Pa = participants; Obs = observers). d, Scatter plot showing correlation of nervousness scores by participants themselves versus the participant model that determines participant scores. e, Weights (coefficients; betas; relevance to model) of features of the participant model (dur. = duration, amp. = amplitude, ave. = average, out. = outer, in. = inner, up = upper, wr = wrinkler, rais. = raiser, arous. = arousal, depres. = depressor, tight = tightener). f, Same as panel d but now for scores by observers versus observer model. g, same as panel e but now for observer model. h, same as panel d and f but now for observers versus participant scores.
Supplemental_online_material.docx
Download MS Word (234.8 KB)Data availability
The data that support the findings of this study can be requested at Neurolytics BV but restrictions apply to the availability of these data, which were provided under licence to the current study, and so are not publicly available. Data are however available from the authors upon reasonable request and with permission of Neurolytics BV. The code that is used to generate the results of this study can be requested at Neurolytics BV but restrictions apply to the availability of this code, which is developed in collaboration with, and is part of the intellectual property of Neurolytics BV, and so is not publicly available. Enquiries can be sent to [email protected].