
Figures & data
Figure 1. Screen stimuli: (a) example of sensitive-content screen with warning and blurred image (all studies), (b) opaque grey screen with no warning (Study 2), (c) example of greyscale geometric shape used as filler stimuli (Study 3).
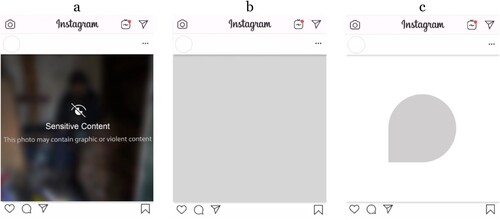
Table 1. Means (and standard deviations) for state anxiety and negative affect, by uncovering behaviour and time (Study 1).
Table 2. Means (and standard deviations) for state anxiety and negative affect, by condition and time (Study 2).
Table 3. Means (and standard deviations) for state anxiety and negative affect, by condition and time (Study 3).