
Figures & data
Figure 1. Example Images of the Stimuli.
Note. The top and bottom rows indicate the natural – and reddish-coloured faces, respectively.
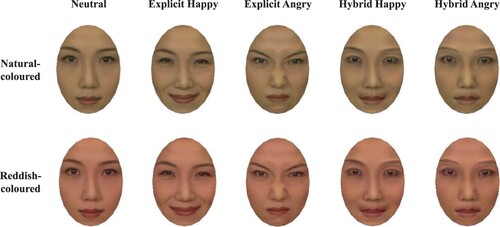
Figure 2. Average Proportion of Selection of Emotional Labels.
Note. The horizontal axis indicates the percentage of labelling. The vertical axis indicates each face condition.
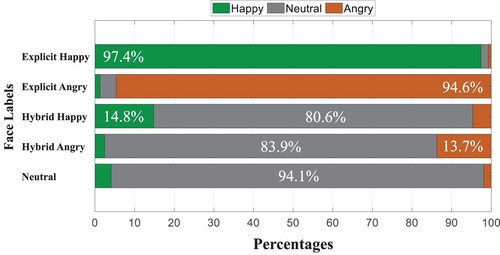
Figure 3. Mean Friendliness Ratings for each Hybrid Face Type.
Note. The horizontal axis indicates each face condition. The vertical axis indicates the mean friendliness ratings. Error bars indicate standard errors and asterisks indicate significant differences by analysis of variance .
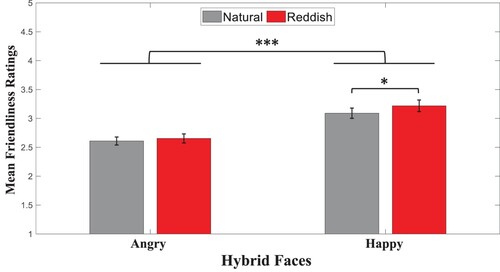
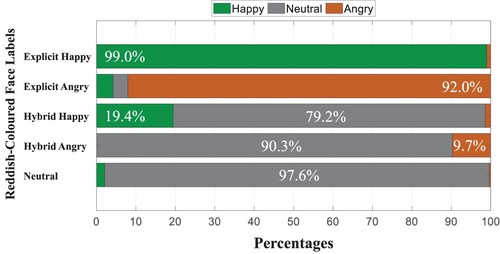
Figure 4. Average Proportion of Selection of Emotional Labels with Reddish-Coloured Faces.
Note. The horizontal axis indicates the percentage of labelling. The vertical axis indicates each face condition.
Data availability
The datasets generated during and/or analysed during the current study are available from the corresponding author on reasonable request.