
Figures & data
Figure 1. PRISMA flowchart of literature search.
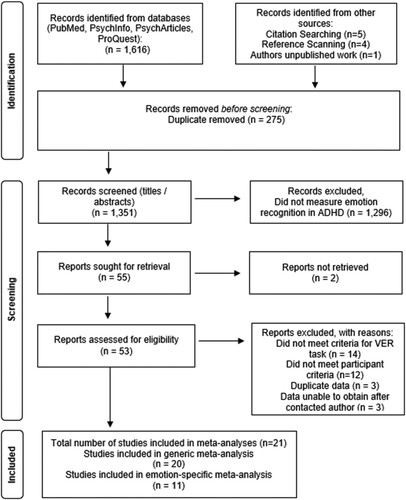
Table 1a. Participant characteristics of included studies.
Table 1b. Design characteristics of included studies.
Table 2. Numerical trends (SMD and Standard Error) of vocal emotion recognition deficits for all categorical exploratory moderator variables.
Figure 2. Forest plot showing SMD (hedges g) for 20 studies which included a generic VER accuracy score, and the corresponding weight of each effect size.
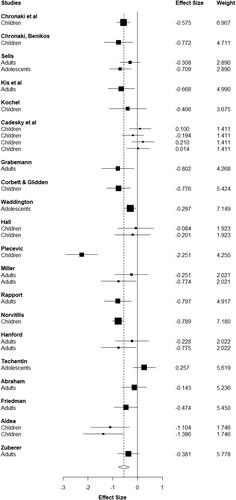
Table 4. Table showing the effect size (Standardise Mean Difference; SMD) and associated statistics for the sensitivity analyses, with and without outliers (w/o).
Figure 3. Funnel plot for generic VER analysis.
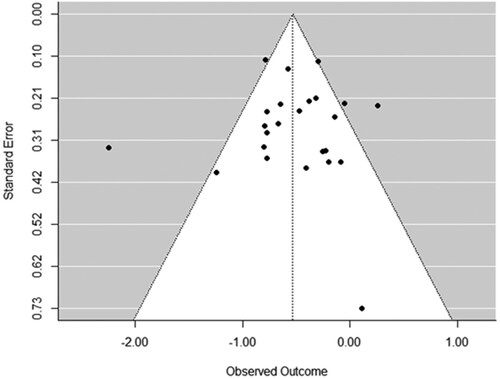
Figure 4. Funnel plot for generic VER analysis without outliers.
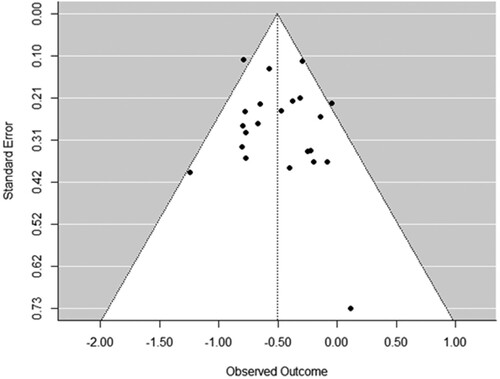
Table 3. Table showing coefficient estimate, and associated t values, significance (p values), and CI of emotion type and valence moderator analyses.Footnote2
Data availability statement
The data that support the findings of this study are openly available in Open Science Framework at DO I 10.17605/OSF.IO/GJM4D.