
Figures & data
Figure 1. Scatterplots and distributions for GRiPS and Non-distracting, GRiPS and Emotional awareness (Survey 1). A lower GRiPS score indicates lower risk propensity. A lower score for Non-distracting suggests a greater tendency to ignore or distract oneself from sensations of pain or discomfort. A lower score for Emotional awareness suggests a lower awareness of the connection between body sensations and emotional states.
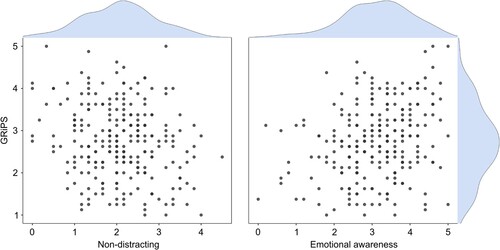
Table 1. Multiple linear regression using original MAIA-2 factors.
Figure 2. Scatter plots, distributions, and linear fit lines with standard error for GRiPS and Non-distracting, Not-worrying, MAIAg (combined sample). A lower GRiPS score indicates lower risk propensity. A lower score for Non-distracting suggests a greater tendency to ignore or distract oneself from sensations of pain or discomfort. A lower score for Not-worrying suggests a greater tendency to worry or experience emotional distress with sensations of pain or discomfort. All men and women from the combined sample are displayed, but note that some regression analyses had exclusions (never more than 1 participant in any single analysis, when standardised residual > |3|).
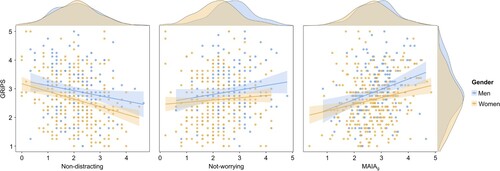
Table 2. Multiple linear regression using alternative MAIA-2 factor structure.
Table 3. Multiple linear regression using original MAIA-2 factors, split by gender.
Table 4. Multiple linear regression using alternative MAIA-2 factor structure, split by gender.
Data availability statement
Data and analysis outputs are freely available and can be found at https://doi.org/10.17605/OSF.IO/FQT4H.