
Figures & data
Figure 1. The shaded nodes represent observable variables, and the unshaded nodes represent unobservable variables. The square nodes represent discrete variables whereas the round nodes represent continuous variables. The double-edged nodes are deterministic nodes while the single-edged nodes are stochastic variables. The right-hand side of the figure shows the evidence weighting component of the model ( and
) which includes the influences of the psychopathological trait (
) variable on evidence weighting for frequently occurring information (
) and infrequent information (
). The left-hand side of the figure shows the belief updating component of the model, for which the reported probability estimation for the correct source of beads (
) is influenced by the number of frequently occurring beads (
) and infrequent beads (
) observed, and the weights assigned to these beads types. The belief updating node (
) contributes to the evidence accumulation (
) for competing hypotheses, which then influences the decision made about the correct source of beads (
) once the decision threshold
is met.
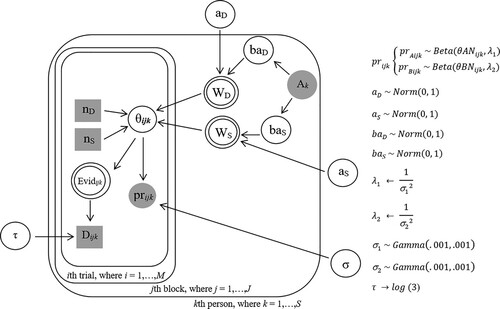
Figure 2. The 55:45 ratio of beads represents the highest uncertainty level in the BT, followed by 70:30, and 90:10 ratio of beads implies the lowest uncertainty level in the BT. The presentation of 12 BTs was randomised for each participant.
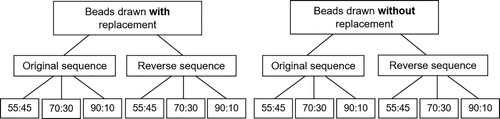
Table 1. Descriptive statistics of psychopathological and decisional variables.
Table 2. Paired comparisons of decisional variables between BTs variations.
Figure 3. The lines were set to terminate once the agent(s) reached a subjective certainty about the source of beads drawn of 99.9% which indicated “absolute certainty”. In most cases, the ideal Bayesian agent would terminate the BT earlier than a human agent.
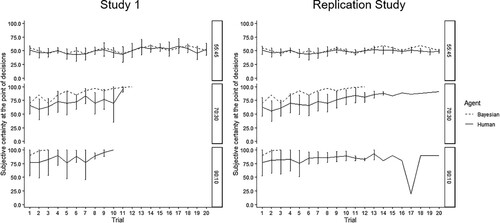
Figure 4. The subjective certainty at the point of decisions was simulated using the Bayesian estimations reported in and Equation (5). The lines were set to terminate when the simulated subjective certainty reached 99.9% indicating absolute certainty about the source of information drawn. The figure shows overlapping lines of subjective certainty across all trials when the level social anxiety was at the mean (0 standard deviation), 3 standard deviations above the mean, and 3 standard deviations below the mean. This means that social anxiety levels did not significantly influence belief updating. Higher general anxiety (purple line) increased belief updating about the correct source of information drawn consistently across all ratios of beads. However, this increase is less observable when the uncertainty level is low (i.e., 90:10 ratio).
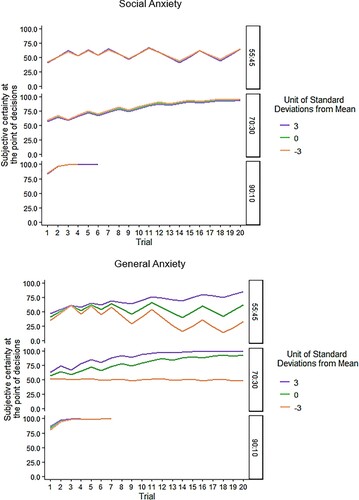
Figure 5. It appears that higher delusional ideation (purple line) only attenuated belief updating in the 70:30 and 90:10 ratios (especially for the first three beads observed) and exhibited an opposite effect under high uncertainty levels in the environment (i.e., 55:45 ratio). This suggests that higher delusional ideation may be associated with the JTC bias about the correct source of information when the uncertainty level is high.
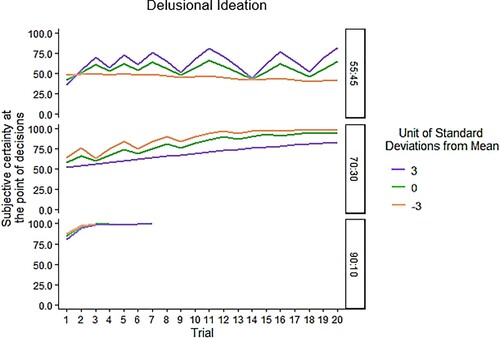
Table 3. Model estimations of the differences in assigning evidence weights across psychopathological traits (Study 1).
Table 4. Model estimations of the differences in assigning evidence weights across psychopathological traits (replication study).