
Figures & data
Figure 1. Predicted pattern of results according to different hypotheses.
Note. Emotion-induced slowing is anticipated when participants have a narrow breadth of attention (i.e. when attending to the local level of Navon). This is depicted in the solid line producing a V-shape in all three graphs. The dashed lines indicate the differential predictions for what will happen when participants have a broad attentional breadth (i.e. when attending to the global level of Navon) according to different hypotheses, as described below. Note. Selective Negative: If a broadened attentional breadth selectively reduces the impact of negative emotionally salient stimuli on performance, emotion-induced slowing should be selectively reduced following negative stimuli in the broad attentional breadth condition relative to the narrow attentional breadth condition. This is depicted by the dashed line showing responses quickening for the negative condition under broad attentional breadth, such that the difference in RTs between the negative and neutral conditions is reduced. In other words, the steepness of the V-shape should be selectively reduced for negative stimuli under broad attentional breadth. Note. All Emotional: If a broadened attentional breadth reduces the impact of all emotionally salient stimuli on performance, emotion-induced slowing should be reduced for both negative and positive stimuli in the broad attentional breadth condition relative to the narrow attentional breadth condition. This is depicted by the dashed line showing responses quickening for the negative and positive condition under broad attentional breadth, such that the difference in RTs between the neutral condition and both the negative and positive conditions is reduced. In other words, the steepness of the V-shape should be reduced for negative and positive stimuli under broad attentional breadth. Note. No Effect: If a broadened attentional breadth does not reduce the impact of any emotionally salient stimuli on performance, then emotion-induced slowing should be observed for both negative and positive stimuli and be of equivalent magnitude in both the narrow and broad attentional breadth conditions. In other words, an equivalent V-shape should be observed in both the broad and narrow attentional breadth conditions. Note. Diagrams are not necessarily to scale and are used for illustrative purposes only.
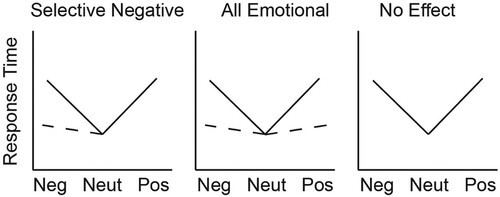
Figure 2. An illustration of an example trial in Experiment 1.
Note. This is an example of a positive trial from the global target block. The cupcakes image is a photo by Brian Chan on Unsplash (a database of images freely available for use without permission), designed to be indicative of an IAPS image without showing one here. Stimuli are not necessarily to scale.
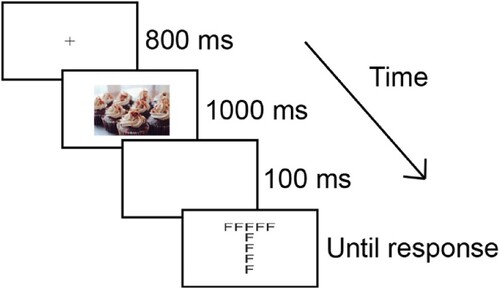
Figure 3. Mean RTs to identify targets at Global versus Local level following each image valence in Experiment 1.
Note. Error bars represent standard errors.
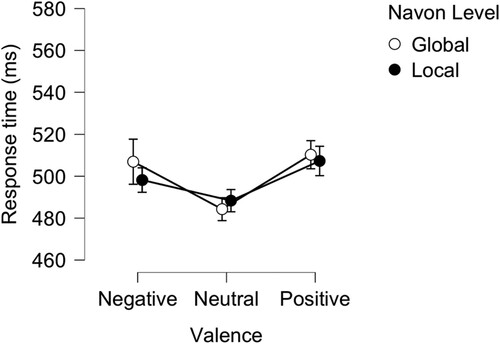
Figure 4. Mean RTs to identify the small letter perceptual outcome as a function of Navon block level in Experiment 2.
Note. Error bars represent standard errors.
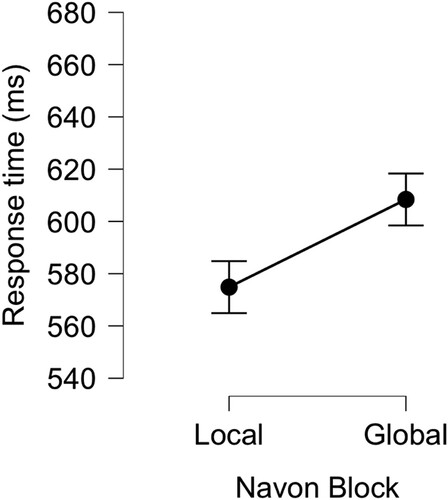
Figure 5. Mean RTs to identify targets at Global versus Local level following each image valence in Experiment 3.
Note. Error bars represent standard error.
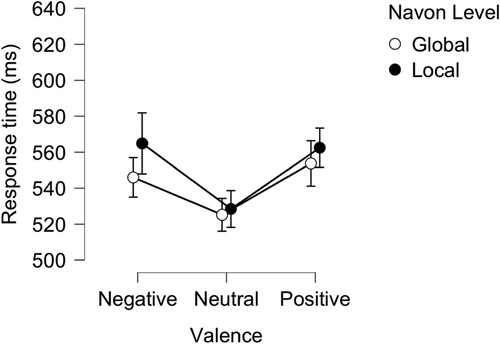
Figure 6. Mean RTs to identify targets at Global versus Local level following each image valence in Experiment 4.
Note. Error bars represent standard error.
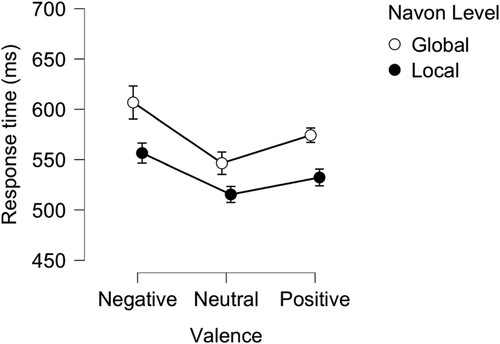
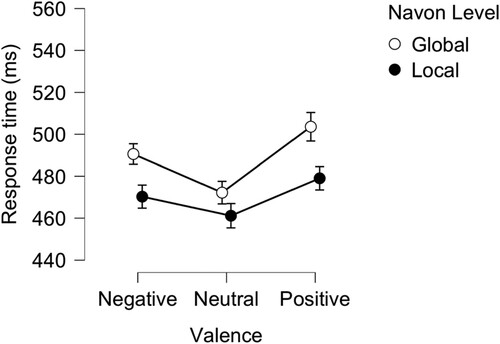
Figure 7. Mean RTs to identify targets at Global versus Local level following each image valence in Experiment 5.
Note. Error bars represent standard error.
AB_Emo_CE_SupplementaryMaterial_Rev2_ToSubmit.docx
Download MS Word (56.8 KB)Data availability statement
Raw data are available here: https://osf.io/n9kq5/.