
Figures & data
Table 1. Descriptive statistics for participant demographics (N = 65).
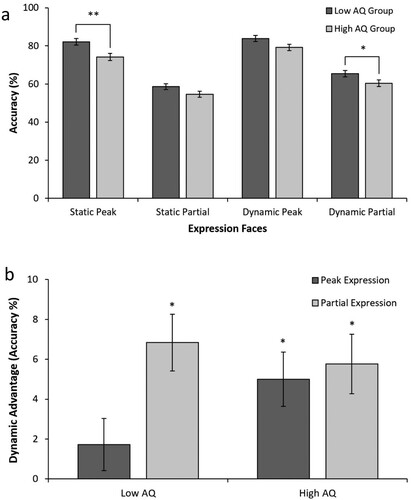
Figure 1. (a) Mean percentage accuracy in FER across dynamism and expression intensities between AQ groups. **p < .01; *p < .05. (b) Magnitude of the dynamic advantage between AQ groups for peak and partial expressions. The figure shows the mean difference in percentage accuracy of FER (dynamic minus static), which is referred to as the dynamic advantage. *A significant dynamic advantage for that condition (i.e. mean difference is greater than 0), p < .001. Error bars indicate standard error of the mean.
Supplemental material