
Figures & data
Table 1. Means, standard deviations and range of scores of the main task variables.
Figure 1. Example of aSART trial sequence.
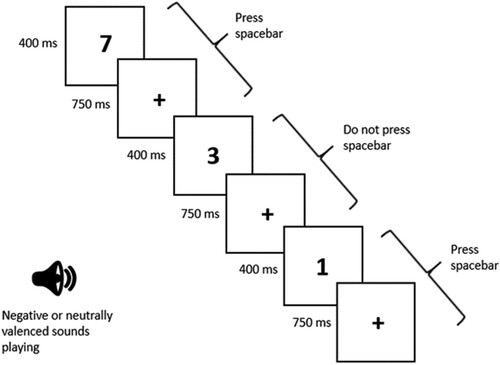
Table 2. Correlations between independent variables.
Figure 2. Mean numbers of aSART commission errors (with one standard error mean) in negative and neutral conditions showing reduced errors across both conditions with older age, from 11 to 18 years.
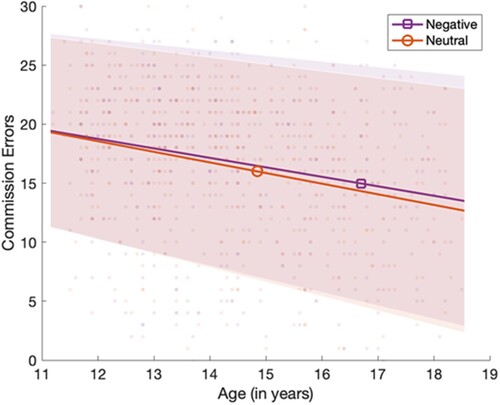
Figure 3. Mean aSART RT variance (with shading indicating one standard error of the mean mean) in negative and neutral conditions, showing reduced RT variance across both conditions with older age, across ages 11 to 18 years.
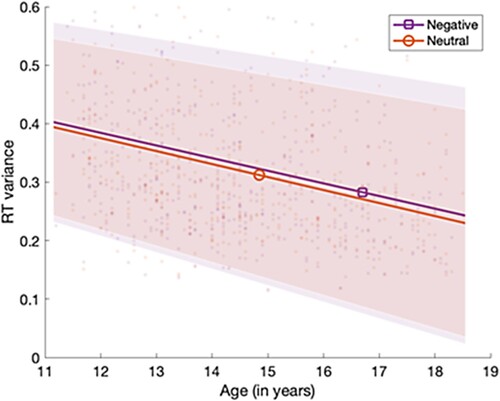
Table 3. Means and standard deviations for age, IQ and depression for those characterised as at risk and at lower risk of depression.
Supplemental material