
Figures & data
Table 1. Demographic data.
Figure 1. Outline of the T-RES paradigm, as used in the current study, and the timeline of the study design.
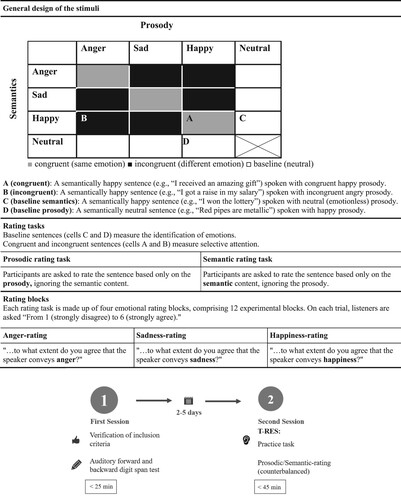
Figure 2. Average and standard deviations (error bars) for the T-RES scores for the three study groups. The height of the respective columns depicts the extent of Identification (Panel A), or failures of Selective Attention (Panel B) to the target channel in the Late Blind (dark bars), the Congenitally Blind (gray bars) and the Sighted Control groups (white bars).
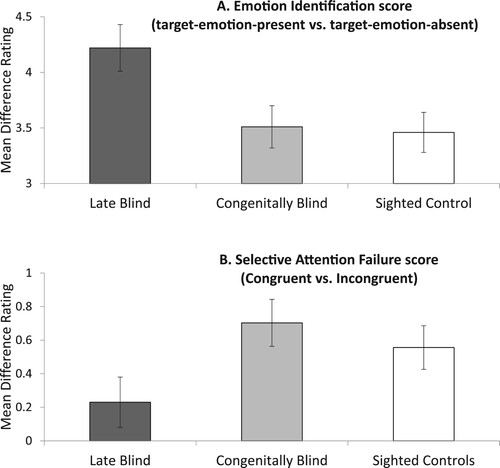
Table 2. Average ratings for the comparison of the three groups.
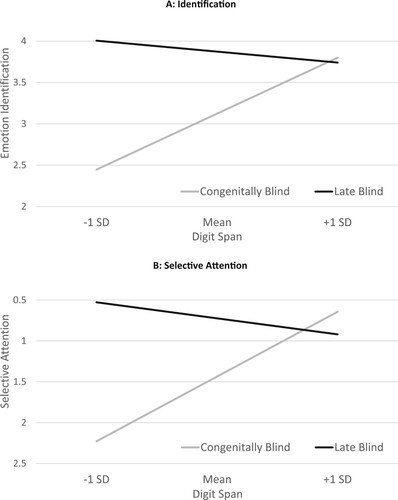
Figure 3. The moderating effect of Digit Span scores on the differences between CB and LB groups in T-RES scores. Higher points on the Y axes represent better performance: better emotion Identification (Panel A) and better (smaller failures of) Selective Attention (Panel B), for CB (gray lines) and LB (dark lines) individuals. X axes represent the distribution of performance on the Digit Span test with relation to the respective group mean.
Appendix_A_B_C_D_E_07_Apr_2024 clean.docx
Download MS Word (127.5 KB)Data availability statement
Data available on request from the corresponding author, due to privacy restrictions.