
Figures & data
Figure 1. The variance of vote choice explained by Partisan identity (PID), race, religion and social class.
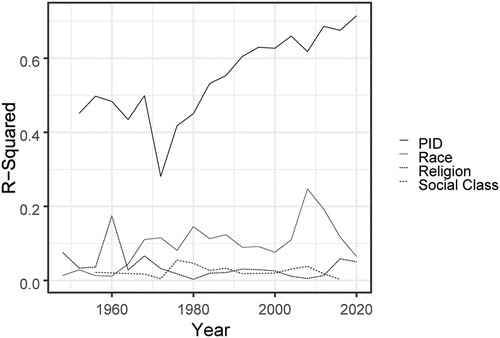
Figure 2. Mean correlation between emotions (anger, hopeful, afraid, and proud) felt towards each party's candidate by party identity and over time.
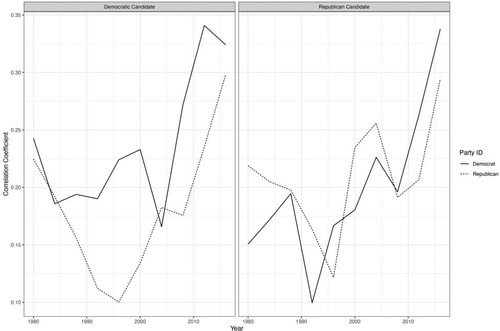
Figure 3. Frequency of each emotion felt thinking about the 2018 US congressional election by party identity strength and emotion.
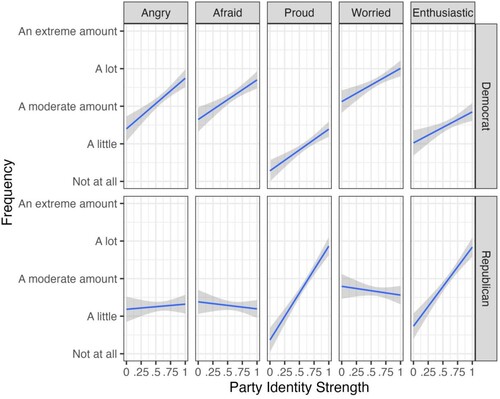
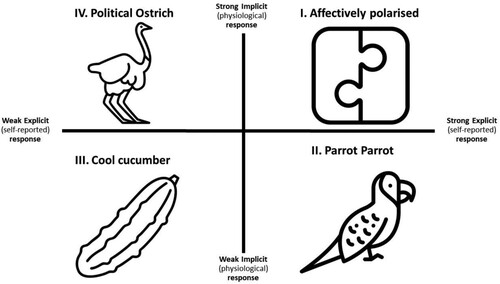
Figure 4. Model of concordance and discordance between explicit and implicit measures of affect as theorised by Arceneaux et al. (Citation2024) and applied to affective polarisation.
Data availability statement
The data and R-code to reproduce the results reported in and can be found on our OSF page https://osf.io/y4jt7/. The data belonging to can be found here: https://doi.org/10.7910/DVN/XI1VKC
.