
Figures & data
Table 1. Questionnaire descriptive statistics.
Table 2. Three-way ANOVA emotion ratings across all object categories.
Figure 1. (a) Interaction effect object category × group: emotion ratings pencil#1 for each object category and group (M and SE). (b) Interaction effect object category × emotion: emotion ratings pencil#1 for each object category (M and SE)
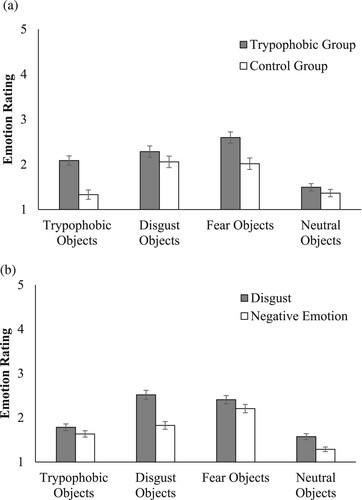
Figure 2. Emotion ratings for natural and human-made trypophobic objects by group (M and SE).
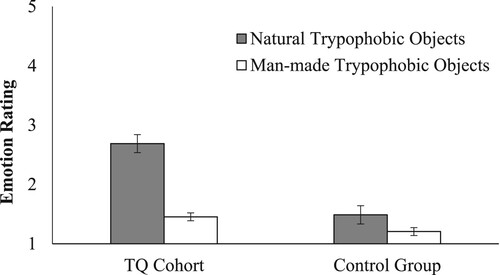
Table 3. Frequency of agreement with statements by group.