
Figures & data
Figure 1. Flow diagram for the number of adolescents included in the study. (20mSRT = 20m shuttle run test, PA = physical activity, BMI = body mass index, MABC2 = Movement Assessment Battery for Children 2nd edition).
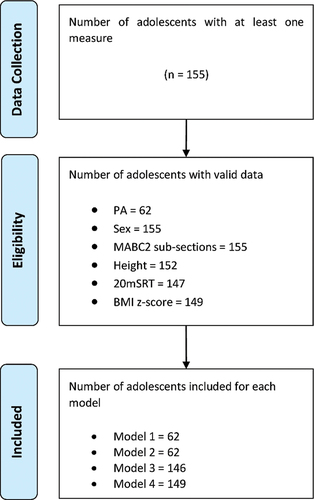
Table 1. Summary characteristics.
Table 2. Multivariate regression model for three subsections of motor competence to MVPA, VPA, total shuttles, and BMI z-score.