
Figures & data
Figure 1. Study design.
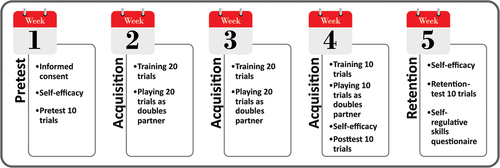
Figure 2. Percentage of feedback requests per block of 5 trials (error bars represent standard deviations).
Figure 3. TTT score in pretest, posttest and retention test for the SC group and YK group (error bars represent standard deviations).
Figure 4. Self-efficacy in pretest, posttest and retention test for SC group and YK group (error bars represent standard deviations).
Table 1. Multiple regression for difference in TTT score between pretest and posttest (i.e., immediate improvement in practice performance).
Table 2. Multiple regression for difference in TTT score between pretest and retention (i.e., learning).
Supplemental material