Figures & data
Figure 1. Mean vegetation biomass (g m−2 wet weight ± standard error (SE)) of high (n = 4; hatched bars) and low (n = 4; open bars) vegetation treatments in eight 0.4-ha ponds at the Sam Parr Biological Station, Kinmundy, IL, used to evaluate the effects of habitat complexity on growth of small bluegill. Mean vegetation biomass was 109 g m−2 ± 21.0 SE in the low vegetation treatment and 712 g m−2 ± 54.3 SE in the high vegetation treatment over the entire experiment.
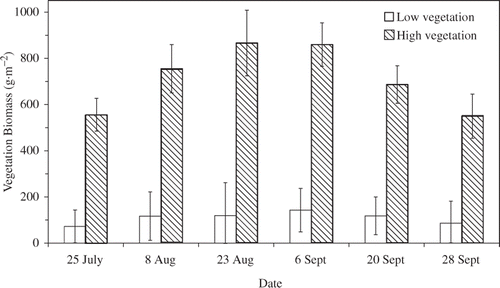
Figure 2. Bluegill length-frequency distribution at the end of a 3-month experiment conducted in eight 0.4-ha ponds. Ponds were either high (712 ± 54.3 g m−2; hatched bars) or low (109 ± 21.0 g m−2; open bars) vegetation biomass treatments. Bluegill were 30–50 mm in TL at the beginning of the experiment. Bars indicate 1 SE.
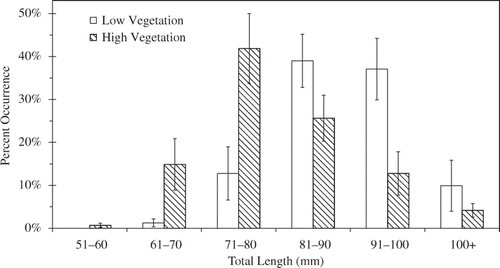
Figure 3. Mean stomach fullness (mg dry prey biomass/g wet bluegill mass) of bluegill from high (712 ± 54.3 g m−2; hatched bars) or low (109 ± 21.0 g m−2; open bars) vegetation treatments over a 3-month experiment conducted in 0.4-ha ponds at the Sam Parr Biological Station to test the effects of vegetation biomass on growth of juvenile bluegill. Bars indicate 1 SE.
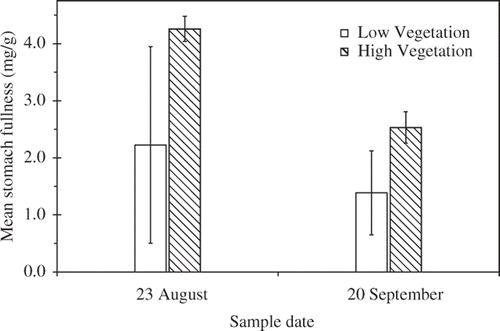
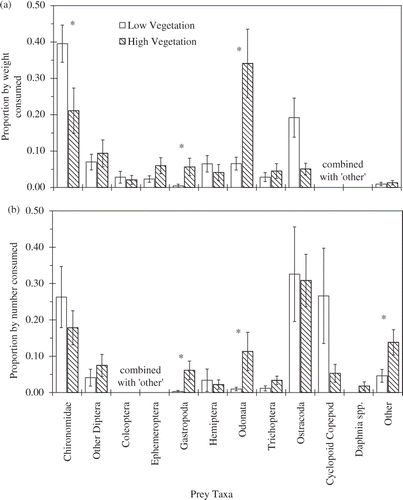
Figure 4. Proportion by weight and number of different prey taxa consumed by juvenile bluegill during a 3-month experiment conducted in 0.4-ha ponds to test the effects of vegetation biomass on growth of bluegill. Ponds were high (n = 4; 712 ± 54.3 g m−2; hatched bars) or low (n = 4; 109 ± 21.0 g m−2; open bars) vegetation biomass treatments. Taxa that always had proportion by weight or number <2% of the total were pooled with unidentifiable taxa as ‘other’. Taxa marked ‘NA’ were grouped as ‘other’ for the analysis. Bars indicate 1 SE.