Figures & data
Table 1. Summary statistics (grand mean, range given within parentheses) for environmental variables used to assess growth of gizzard shad.
Figure 1. Length frequencies of gizzard shad collected from the study reservoirs during 2004–2008. Mean (SE) electrofishing (CPUE, number/h) is also shown.
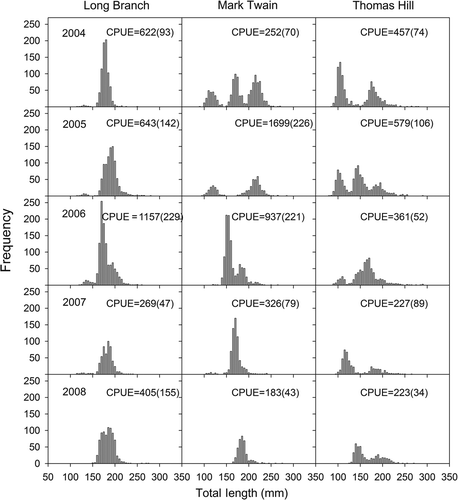
Figure 2. Age composition (%) of gizzard shad in the study reservoirs during 2004–2008.
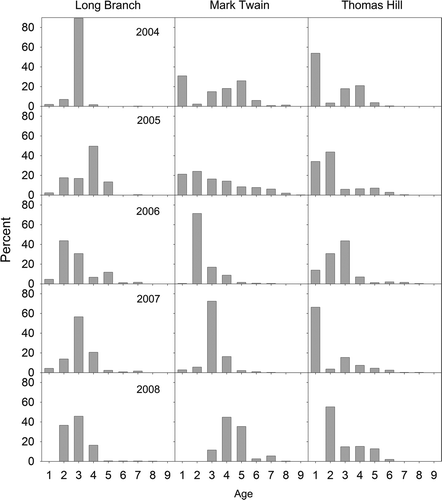
Figure 3. Von Bertalanffy growth curves for gizzard shad in Long Branch (LOB), Mark Twain (MTL), and Thomas Hill (THL) lakes. Equations are lt = 245.533(1–e −0.284( t + 1.863)) for LOB (r 2 = 0.98; p < 0.0001), lt = 233.473(1–e −0.412( t + 0.830)) for MTL (r 2 = 0.99; p < 0.0001), and lt = 244.282(1–e −0.346( t + 0.755)) for THL (r 2 = 0.99; p < 0.0001). Mean length for age 7 in Thomas Hill Lake was not computed due to very low sample size.
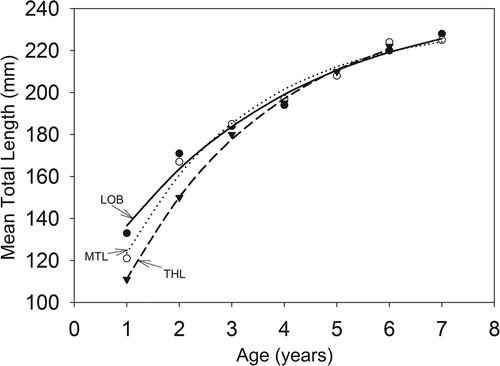
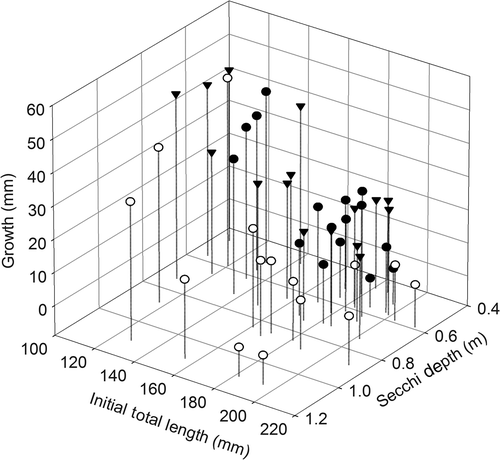
Figure 4. Three-dimensional scatter plot showing the influence of initial total length of gizzard shad and Secchi depth on growth increments of gizzard shad in Long Branch (solid circle), Mark Twain (open circle), and Thomas Hill (solid, upside-down triangle) lakes.