Figures & data
Table 1. Results of the two-way ANOVA on the relative growth rate of three common algae.
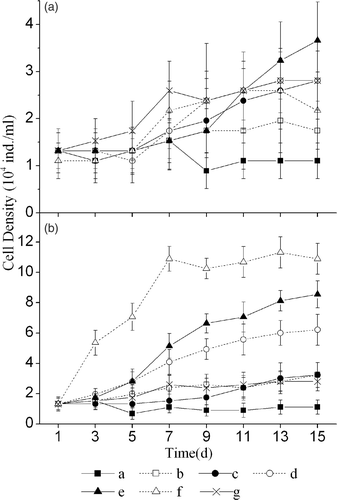
Figure 1. The effect of culture solutions (a) and extract solutions (b) of six macrophytes on the growth of Chlorella pyrenoidosa (a: H. sibthorpioides; b: H. verticillata; c: V. natans; d: I. aquatica; e: M. verticillatum; f: J. repens; g: control).
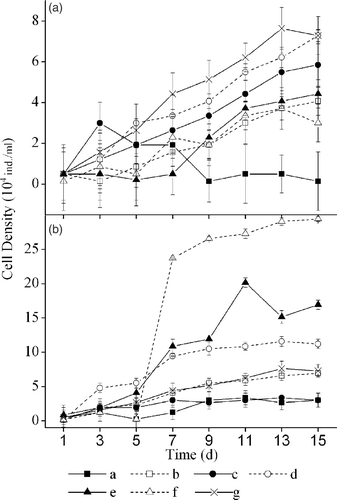
Table 2. Mean relative growth rate of C. pyrenoidosa grown for 15 d in culture and extract solutions derived from six macrophytes (mean ± SE, n = 3).
Figure 2. The effect of culture solutions (a) and extract solutions (b) of six macrophytes on the growth of Scenedesmus obliquus. The legends are the same as in .
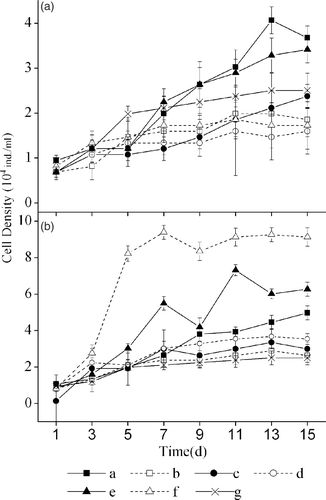
Table 3. Mean relative growth rate of S. obliquus grown for 15 d in culture and extract solutions derived from six macrophytes (mean ± SE, n = 3).
Figure 3. The effect of culture solutions (a) and extract solutions (b) of six macrophytes on the growth of Microcystis aeruginosa. The legends are the same as in .