Figures & data
Figure 1. Smoky madtom (top, photo by J. Miller) and yellowfin madtom (bottom, photo by K. Gibbs) in lower Abrams Creek, Great Smoky Mountains National Park, Tennessee.
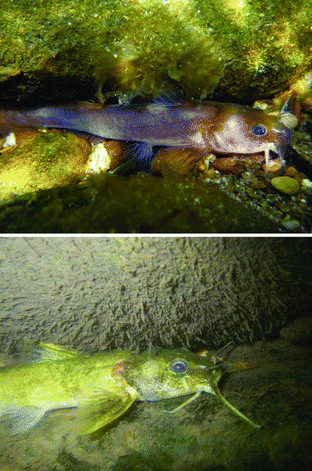
Figure 2. Distribution map of smoky and yellowfin madtoms determined during macrohabitat snorkeling surveys conducted during 2007 and 2008 in lower Abrams Creek, Blount County, TN.
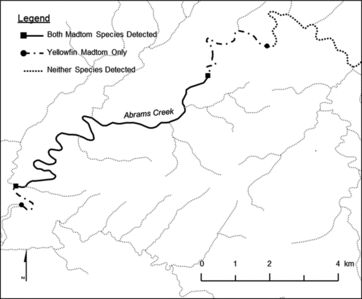
Figure 3. Comparison of catch per unit effort during macrohabitat snorkeling surveys to average stocking density per year for smoky and yellowfin madtoms in lower Abrams Creek.
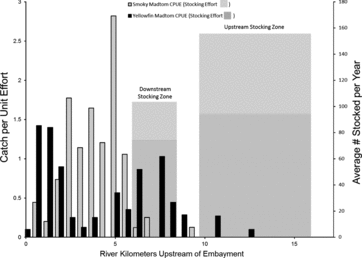
Table 1. Correlation coefficients of habitat variables with principle component vectors (PC1, PC2, and PC3). Values in parenthesis indicate the proportion of the total variability predicted by the PC variable.
Figure 4. Ordination plots of principal component analysis: PC1 vs. PC3 (12.7%, upper) and PC1 (53.2%) vs. PC2 (16.2%, bottom) for reach-level macrohabitat in relation to smoky and yellowfin madtom occurrences within lower Abrams Creek.
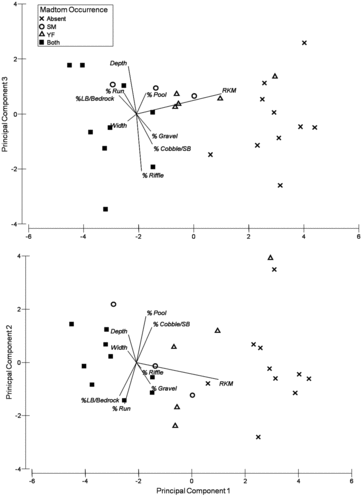
Figure 5. Classification tree analysis for microhabitat data of occupied (present) and unoccupied (absent) locations of smoky madtoms in lower Abrams Creek. Predictor variables in italics resulted in the most parsimonious split of parent nodes.
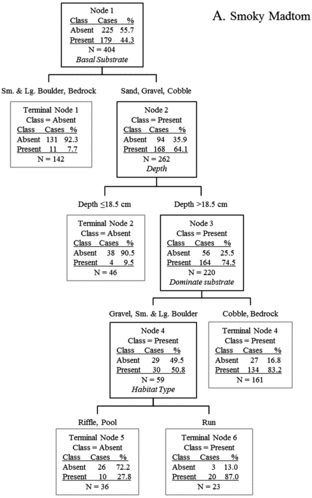
Figure 6. Classification tree analysis for microhabitat data of occupied (present) and unoccupied (absent) locations of yellowfin madtoms in lower Abrams Creek. Predictor variables in italics resulted in the most parsimonious split of parent nodes.
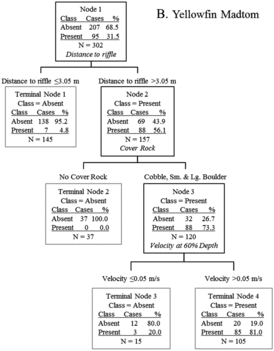
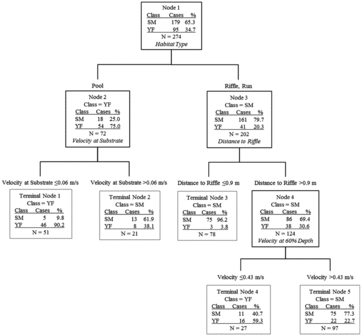
Figure 7. Classification tree comparing microhabitat used by smoky madtoms (SM) and yellowfin madtoms (YF) in lower Abrams Creek. Predictor variables in italics resulted in the most parsimonious split of parent nodes.