
Figures & data
Figure 1. Map of study area including the four sample sites along the Licking River, KY with site 1 in the most urban area.
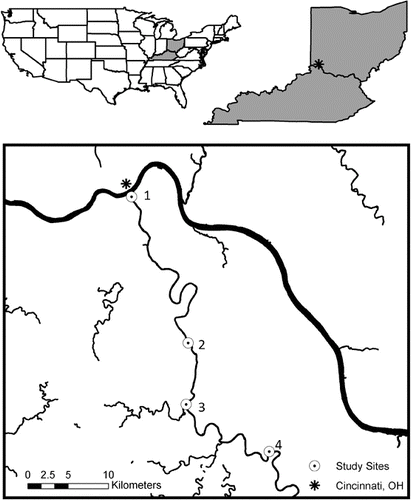
Table 1. All sites averaged by season ± standard error for denitrification potential (DNF) and regulating factors. Minimum and maximum values in parentheses.
Figure 2. Average seasonal denitrification potential and standard error among study sites. Site 1 had the greatest impervious surface.
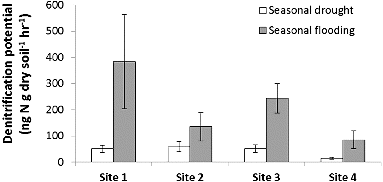
Figure 3. Average monthly riparian potential denitrification rate for all sites along the Licking River corresponds with river discharge. River discharge data were collected from USGS gage #03254520 (USGS Citation2011).
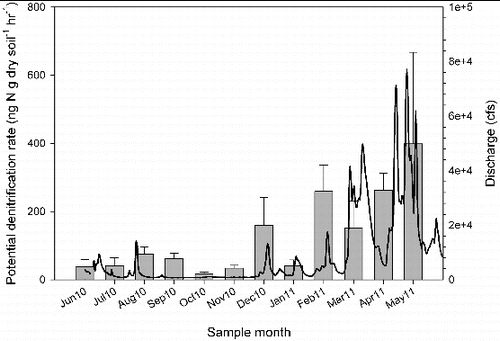
Figure 4. Average seasonal soil organic matter and standard error among study sites. Site 1 had the greatest impervious surface.
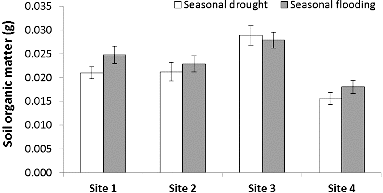
Figure 5. Average seasonal water NO3−–N concentration and standard error among study sites. Site 1 had the greatest impervious surface.
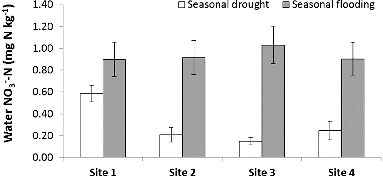
Figure 6. Average seasonal soil NH4+–N concentration and standard error among study sites. Site 1 had the greatest impervious surface.
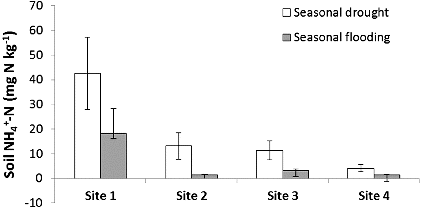
Table 2. Percent cover of each cover class analyzed at each of the four study sites. Site 1 was near the confluence in Newport, KY, site 2 was 30.7 km upstream near Visalia, KY, site 3 was 39.5 km upstream near Morning View, KY, and site 4 was 59.3 km upstream in Butler, KY.
Figure 7. Aerial photographs with delineated land cover classes for study sites 1, 2, 3, and 4. Land cover classes were tabulated within a 1000 m long by 200 m wide segment upstream from each study site.
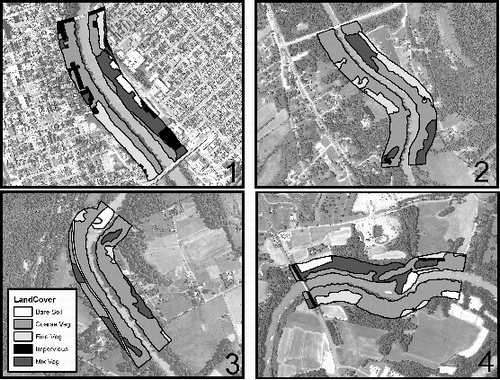
Table 3. Relationship between denitrification potential rate and measured potential regulators (covariates) among study sites (analyzed using ANCOVA, n = 96, df1 = 3, df2 = 92).
Figure 8. Relationships of regulator and covariate soil organic matter with denitrification potential (a) and soil NO3−–N (b).
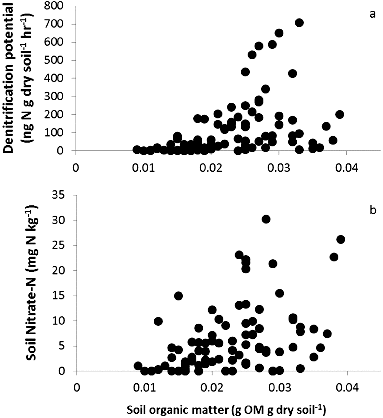
Table 4. Average denitrification potential (DNF) and average water nitrate concentration of soils from riparian areas and two marshes along larger rivers. Ag stands for agriculture and n.a. stands for data not available.
Table 5. Urban riparian average denitrification potential (DNF) ± standard error (SE) of soils with depth of sample used for DNF analysis. Bold indicates data from current studyand n.a. stands for data not available.