
Figures & data
Figure 1. Locations of the abandoned pyrite mines and the sampling sites.
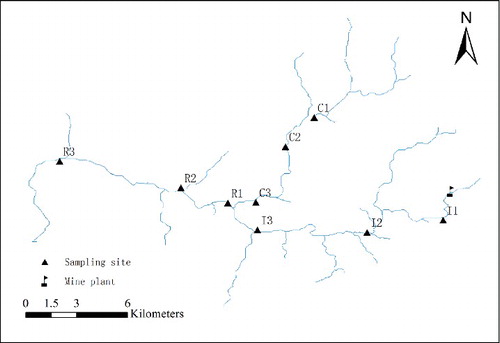
Table 2. Observed functional groups at sampling sites.
Table 3. Mean and standard deviation (SD) of pH and metal concentrations at sampling sites.
Figure 2. Density of macroinvertebrates at sampling sites.
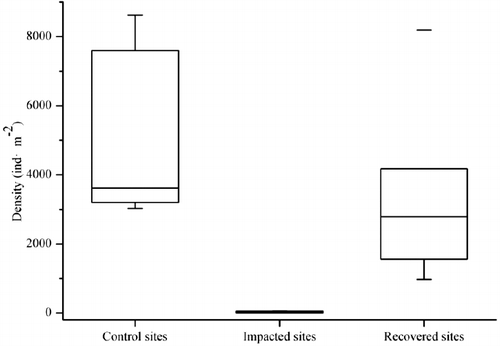
Table 4. Mean and standard deviation (SD) of macroinvertebrate metrics at sampling sites.
Table 5. Pearson correlations of functional diversity metrics against AMD parameters.
Figure 3. Proportion of functional groups at sampling sites.
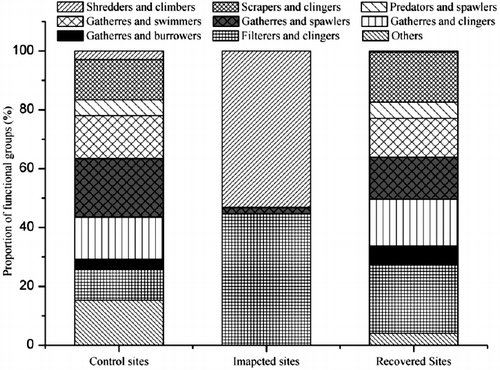
Figure 4. Biomass of benthic algae (measuring with Ch1a) at sampling sites.
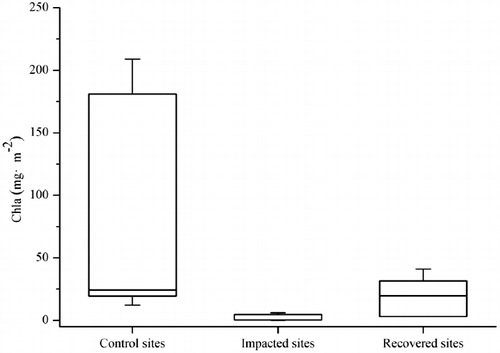
Table 1. Elevation, mean of channel width and water depth at sampling sites.