
Figures & data
Figure 1. Jumping apparatus used to test jumping ability of fish.
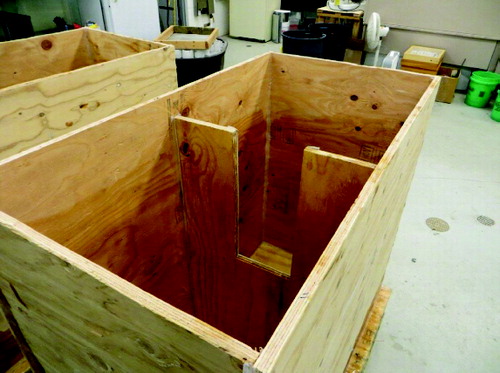
Table 1. The mean maximum swimming velocity (±SE) and mean length (±SE) of each species of fish tested. Maximum velocity recorded for each species is also listed. The r2 squared value is listed for the correlation between length of fish and maximum velocity for each species. The highest jump completed (cm) is listed for each species.