Figures & data
Figure 1. Missouri River basin and location of the Lewis and Clark Delta along the South Dakota–Nebraska border, USA. The upstream end of the Delta is located near its confluence with the Niobrara River (576907 N, 4734800 E). The downstream end of the Delta is located where the reservoir portion of Lewis and Clark Lake begins (594446 E, 4743533 N).
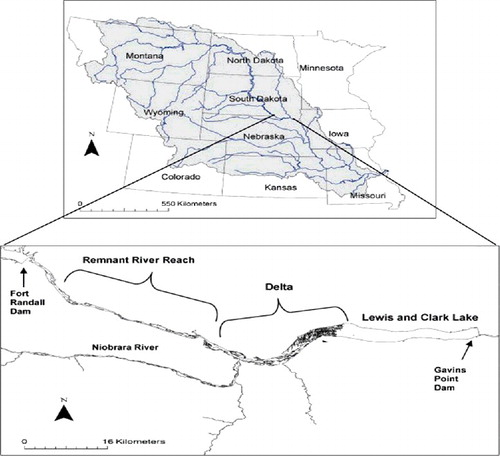
Figure 2. Gage height in the Lewis and Clark Delta at Springfield, South Dakota, from 1980 to 2012. The 2011 flood was the most severe hydrological disturbance in recent history. Gage height was measured by the United States Geological Survey (USGS gage 06466700, 408905 E, 4745408 N).
Table 1. Numbers of introduced, native, sport, and small-bodied fishes collected from 2004 to 2012 in the Lewis and Clark Delta.
Table 2. Structural indices (species richness [S], evenness [J′], diversity [Fisher's α]) of common fishes collected during pre-flood (2005, 2008, 2009) and post-flood (2012) periods in the Lewis and Clark Delta.
Figure 3. Nonmetric multidimensional scaling (NMS) ordinations of mean catch per unit effort (CPUE) for juvenile native and sport fishes during pre-flood (2004–2010), flood (2011), and post-flood (2012) periods in the Lewis and Clark Delta, South Dakota–Nebraska, USA. Multivariate heterogeneity is explained by changes in CPUE of individual species (bottom panel). Different letters indicate significant differences in mean CPUE among time periods for particular species. CAP = common carp; FRD = freshwater drum; RIC = river carpsucker; BGL = bluegill; BLC = black crappie; SMB = smallmouth bass; WHC = white crappie.
Figure 4. Nonmetric multidimensional scaling (NMS) ordinations of mean catch per unit effort (CPUE) for adult native and sport fishes and small-bodied species during pre-flood (2004–2010), flood (2011), and post-flood (2012) periods in the Lewis and Clark Delta, South Dakota–Nebraska, USA. Multivariate heterogeneity is explained by changes in CPUE of individual species (bottom panel). Different letters indicate significant differences in mean CPUE between time periods for particular species. CAP = common carp; FRD = freshwater drum; RIC = river carpsucker; SHR = shorthead redhorse; BGL = bluegill; CCF = channel catfish; LMB = largemouth bass; SAR = sauger; EMS = emerald shiner; RES = red shiner; SFS = spotfin shiner.
Figure 5. Pre-flood (June 2010) and post-flood (October 2011) frequency of side channels, backwaters, and sandbars in the Lewis and Clark Delta between the Niobrara River confluence and the downstream limit of the Delta in Springfield, SD. Habitat features were enumerated on 30 equidistantly spaced transects (perpendicular to the main channel) between the Niobrara River confluence and the downstream end of the Delta in ARCMap 10.1 using aerial photographs taken during months with comparable gage height (∼4.5 m).