
Figures & data
Figure 1. Map of Valley Creek, MN, USA showing study locations. This map was created using ArcGIS software by Esri. ArcGIS and ArcMap™ are the intellectual property of Esri and are used herein under license. Copyright © Esri. All rights reserved. For more information about Esri software, please visit www.esri.com.
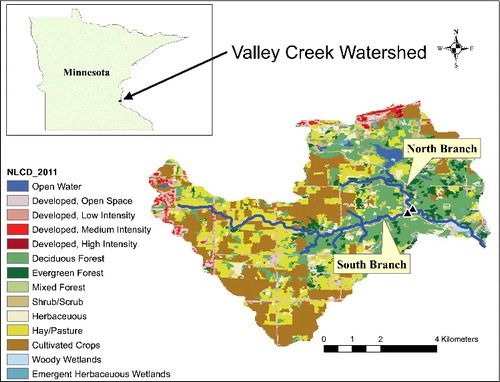
Table 1. Physical and chemical characteristics of the two branches of Valley Creek, Minnesota. Values in parentheses are standard deviations.
Table 2. Macroinvertebrate density and feeding habits. Values in parentheses are standard deviations.
Table 3. Fishes collected from Valley Creek with dip netting and electroshocking.
Table 4. Biological characteristics of two branches of Valley Creek, Minnesota.
Figure 2. Mean leaf decomposition rates as loss of dry weight for two species of leaves (black cherry and common buckthorn) from two locations in Valley Creek, MN over two time periods. Vertical lines show one standard deviation from the mean.
Figure 3. Mean periphyton production rate, measured as chlorophyll a changes, from two locations in Valley Creek, MN over two time periods. The potential for nutrient limitation influencing production was examined by comparing a control (C) with treatments of enrichment with nitrogen (N), phosphorus (P), or both (N + P). Vertical lines show one standard deviation from the mean.
Figure 4. Per cent oxygen saturation (taken at 15-min intervals) for two locations in Valley Creek, MN. Upper panel represents the North Branch; lower panel represents the South Branch. Gaps in the graphs are due to instrument malfunctions.
Figure 5. Temporal changes in daily measures of stream metabolism (measured as mg O2 m−2 d−1) at two locations in Valley Creek, MN. Top panel represents gross primary production (GPP), middle panel represents ecosystem respiration (ER), and the bottom panel represents net ecosystem production (NEP). Gaps in the graphs are due to instrument malfunctions.
Table 5. Comparison of abiotic, structural, and functional measures of the two Valley Creek branches.