Figures & data
Figure 1. Cytograms by flow cytometry analysis of samples from the surface water: (A) chlorophyll (FL3) vs. side scatter (SSC) and (B) chlorophyll (FL3) vs. phycoerythrin (FL2) fluorescence.
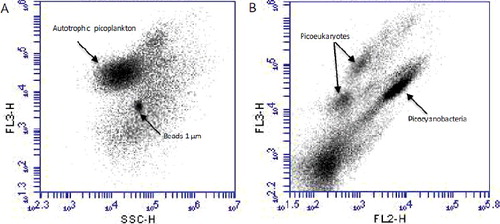
Figure 2. Seasonal and vertical distribution of chlorophyll-a concentrations (µg/L) for the picoplankton fraction in the Cerrillos Reservoir.
Figure 3. (A) Total chlorophyll-a (0.7 µm fraction) and >2 µm fraction of phytoplankton in the surface water of Cerrillos Reservoir. (B) Autotrophic picoplankton (APP) chlorophyll-a concentrations (<2 µm fraction) and their relative contributions to total chlorophyll-a in the surface water of Cerrillos Reservoir. Bars represent standard error.
Figure 4. Seasonal and vertical distributions of picocyanobacteria (cells/mL) in the Cerrillos Reservoir.
Figure 5. Vertical profiles of temperature (C), picocyanobacteria (Pcy, cells/mL) and picoeukaryotes (Peuk, cells/mL) during: (A) mixing (February) and (B) stratification (September) in Cerrillos Reservoir. Bars represent standard error.
Figure 6. Seasonal and vertical distributions of picoeukaryotes (cells/mL) in the Cerrillos Reservoir.