Figures & data
Table 1. Long-term gill net data for Walleye collected in Onondaga Lake (May–October; 2005–2012).
Figure 1. Map of Onondaga Lake, Syracuse, New York. * indicates passive receiver locations.
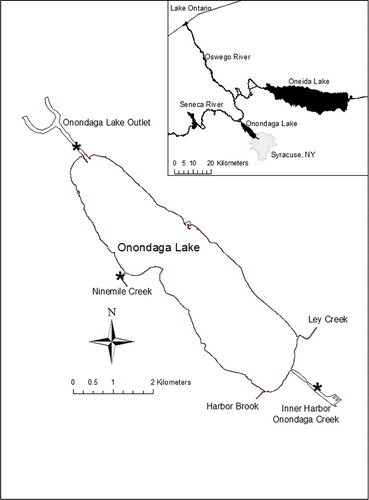
Table 2. Tag information for Walleye collected in Onondaga Lake.
Figure 2. Passive receiver detections of tagged Walleye observed in the Onondaga Lake outlet (2010–2011). 95% confidence intervals are displayed.
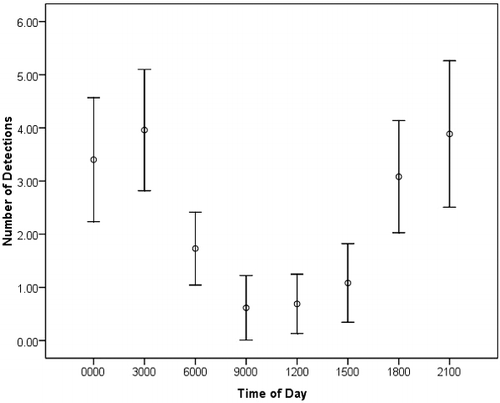
Table 3. Total and straight-line distance measurements for Walleye tracked in Onondaga Lake in 2010.
Table 4. Total and straight-line distance measurements for Walleye tracked in Onondaga Lake in 2011.
Figure 3. Mean distance travelled (m∙h−1) by tagged Walleye in Onondaga Lake (May–November, 2010–2011) during daily time periods. 95% confidence intervals are displayed.

Figure 4. Mean depth (m) utilized by tagged Walleye in Onondaga Lake (May–November, 2010–2011) during daily time periods. 95% confidence intervals are displayed.
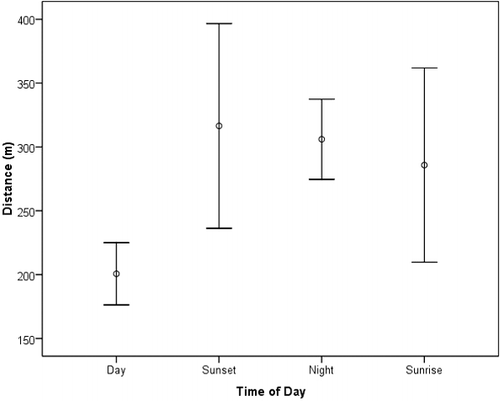
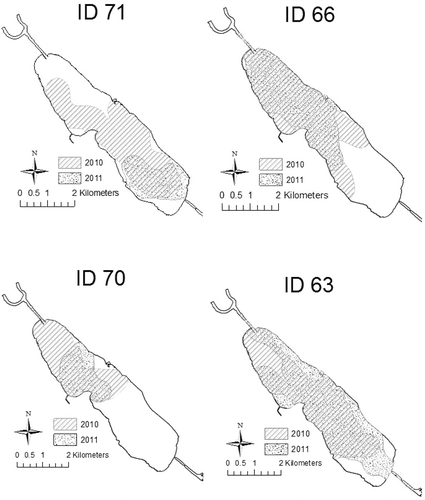
Figure 5. Home range maps for four Walleye, showing range overlap in Onondaga Lake between in 2010 and 2011.