Figures & data
Figure 1. Map of the study and sampling sites.
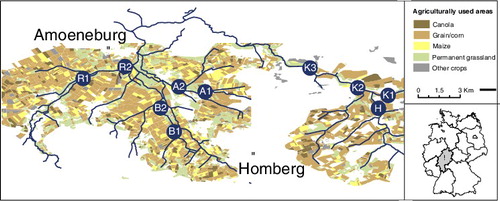
Table 1. Selected environmental and structural variables and algal data with the corresponding seasonal mean ± SE for ditches (n = 99) and streams (n = 269).
Table 2. Mean abundance of suspended and attached algal species counted at all sampling sites in April 2012.
Figure 2. Monthly averaged, log transformed suspended:attached algal ratio calculated. It was calculated with the monthly mean of the suspended photosynthetically active pigments (PAP) above the area sampled for attached algae at all sites and the monthly mean of the attached algae PAP. Displayed are 95% confidence intervals for each monthly mean. The dashed reference line separates the two areas where either the suspended algal fraction (>0) or the attached algal fraction (<0) increases their contribution to the algal community.
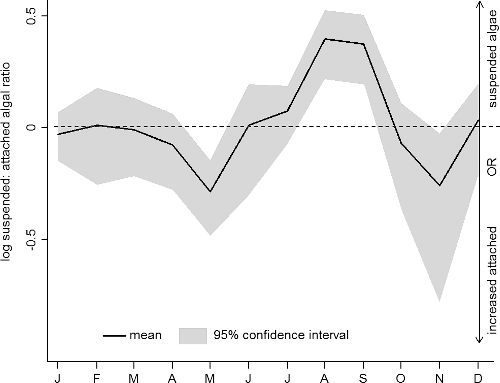
Figure 3. Redundancy analysis, showing suspended algal group scores (Diat, diatoms; Gre, green algae; Cry, cryptophytes; Cya, cyanobacteria), plotted relative to the significant environmental and structural variables (p ≤ 0.05, assessed with a Monte Carlo permutation test) and sampling sites. Sampling sites were classified according to season; spring: •, summer: ■, autumn: ▴, winter: x. In suspended algal composition, 39.2% of the variations can be explained by the environmental and structural variables, of which 96.7% is displayed by the first two axes.
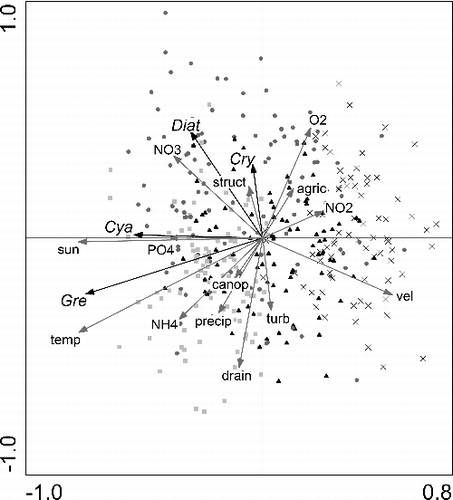
Table 3. Explanatory power of the environmental and structural variables (%) from RDA analyses.
Table 4. Summary of redundancy analyses (RDA) performed with the suspended and attached algal dataset with and without introducing season as a covariable.
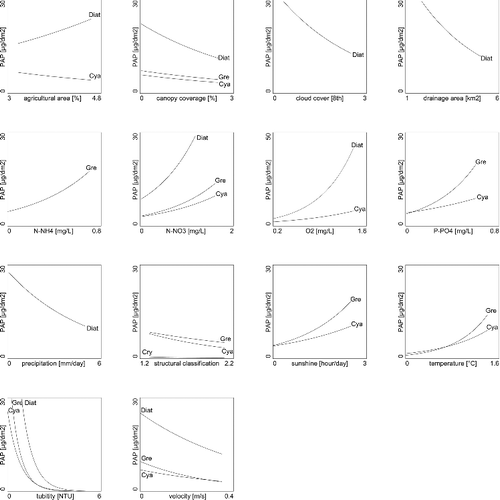
Figure 4. Abundance of suspended algal groups (Diat, diatoms; Gre, green algae; Cry, cryptophytes; Cya, cyanobacteria) plotted versus significant (p ≤ 0.05) environmental and structural variables (log(x+1) transformed), assessed with a Monte Carlo permutation test. A line-of-fit, estimated by GLM, is plotted for suspended algal groups which are significantly correlated with environmental and structural variables (determined with F-ratio statistics p < 0.05).
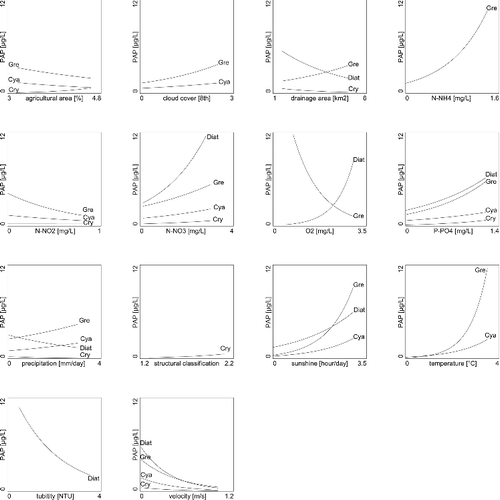
Figure 5. Redundancy analysis, showing attached algal group scores (Diat, diatoms; Gre, green algae; Cry, cryptophytes; Cya, cyanobacteria), plotted relative to the significant environmental and structural variables (p ≤ 0.05, assessed with a Monte Carlo permutation test) and sampling sites. Sampling sites were classified according to season; spring: •, summer: ■, autumn: ▴, winter: x. In attached algal composition, 27.4% of the variations can be explained by the environmental and structural variables, of which 95.3% is displayed by the first two axes.
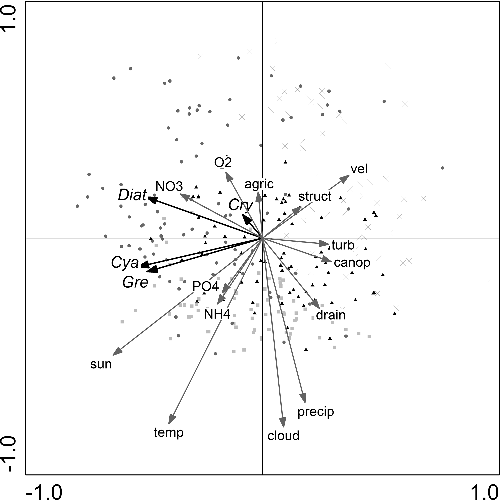
Figure 6. Abundance of attached algal groups (Diat, diatoms; Gre, green algae; Cry, cryptophytes; Cya, cyanobacteria) versus significant (p ≤ 0.05) environmental and structural variables (log(x + 1) transformed), assessed with a Monte Carlo permutation test. A line-of-fit, estimated by GLM, is plotted for attached algal groups which are significantly correlated with environmental and structural variables (determined with F-ratio statistics p < 0.05).