Figures & data
Table 1. Number of individuals of each species (N), range and mean of relative shear stress (RSS), p-value for the difference in RSS among the species’ respective habitats, Spearman's rank correlation coefficient (ρ) between shear stress and total abundance and its significance for each site sampled from June to October, 2012, in the Choctawhatchee River watershed (*indicates significant and ** indicates highly significant difference or correlation).
Figure 1. Relative shear stress (RSS) calculated for each individual of the two mussel species collected at BS from June to October, 2012 (ᴼ indicates outliers that are values between 1.5 X interquartile range (IQR) and 3 X IQR and x indicates extreme outliers that are values greater than 3 X IQR. Outliers and extreme outliers indicate that data can be variable and individuals can be distributed in a highly variable range of relative shear stress conditions).
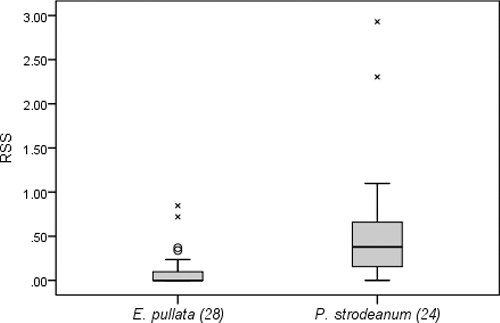
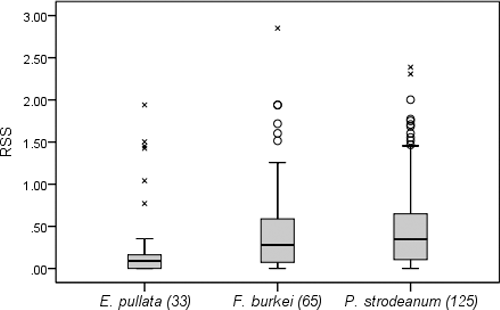
Figure 2. Relative shear stress (RSS) calculated for each individual of the three mussel species collected at 8M1 from June to October, 2012 (x indicates extreme outliers).
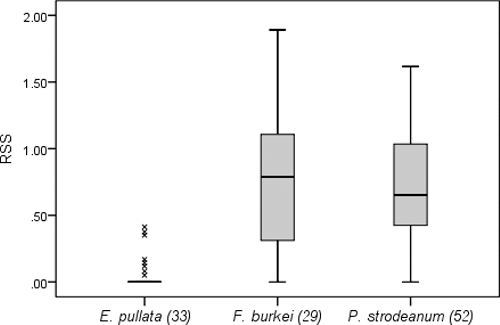
Figure 3. Relative shear stress (RSS) calculated for each individual of the three mussel species collected at 8M2 from June to October, 2012 (ᴼ indicates outliers and x indicates extreme outliers).