Figures & data
Figure 1. Effects of fixative on heterotrophic bacterial counting. (a) Bacterial counts fixed with formaldehyde (FA), glutaraldehyde (GA) and paraformaldehyde (PFA) using different samples from Lake Taihu. (b) Comparison of the three selected fixatives. ANOVA demonstrated that the use of PFA yielded significant lower bacterial abundance (p = 0.007).
Figure 2. Effects of storage temperature and storage time on bacterial counting. (a) Samples fixed by FA and preserved in liquid nitrogen (Liquid-N), in −80 and in 4 °C. (b) Samples fixed by GA and preserved in liquid nitrogen (Liquid-N), in −80 and in 4 °C. ANOVA demonstrated that storage temperature did not have significant effect on bacterial counting (p = 0.75 for FA fixed samples; p = 0.32 for GA fixed samples). (c) Loss ratio (%) of bacterial cells fixed by FA after 0.5, 1, 3, 5, 12 months’ storage under 4 °C.
Figure 3. Effect of ultrasonication on green fluorescence intensity (a) and bacteria abundance (b) using two samples (Site 4# and Site 22#) from Lake Taihu (see Figure S1).
Figure 4. Effects of the concentration of stain (a) and the staining time (b) on bacteria counting using two samples (Site 4# and Site 22#) from Lake Taihu (see Figure S1). x-Axis of the left panel showed the relative values of the working concentration of commercial SYBR Green I solution.
Figure 5. Regression analysis (a) and paired t-test (b) of heterotrophic bacterial abundance in Lake Taihu counted by flow cytometry (FC) stained by SYBR Green I and epifluorescence microscopy (EpiM) stained by DAPI.
Figure 6. Spatio-temporal distributions of bacterial abundance (a), total suspended solids (TSS) and chlorophyll-a (Chl-a) in 2013 in Lake Taihu.
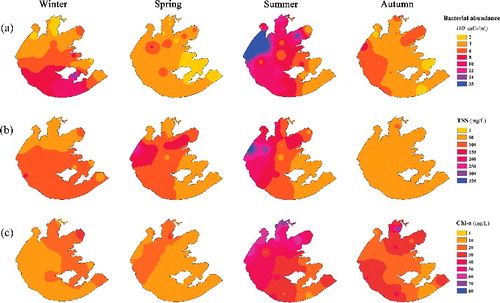
Figure 7. Generalized additive model (GAM) plots identifying the additive effect of water temperature (WT), total suspended solids (TSS), chlorophyll-a (Chl-a) and dissolved organic carbon (DOC) on bacterial abundance in Lake Taihu. Each mark along the x-axis represents a single observation. The y-axis represents the degree of smoothing with its range indicative of the relative importance of the covariate. Dotted lines represent 95% confidence intervals around response curves. Note that TSS and Chl-a were square root transformed before the analysis.