Figures & data
Figure 1. Top photo – Neches River channel upstream from the saltwater barrier; bottom photo – saltwater barrier on Lower Neches with gates in open position.
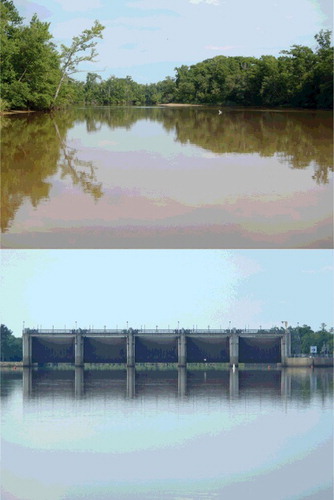
Figure 2. Seine (circles) and gillnet and water quality sites (both represented by triangles) during summer 2012. Differences in water quality (optics) above the saltwater barrier, below the saltwater barrier, and within the MeadWestvaco paper mill effluent delivery canal and rectangular collecting pond witin the Beaumont Unit are apparent in this GoogleEarth® image.
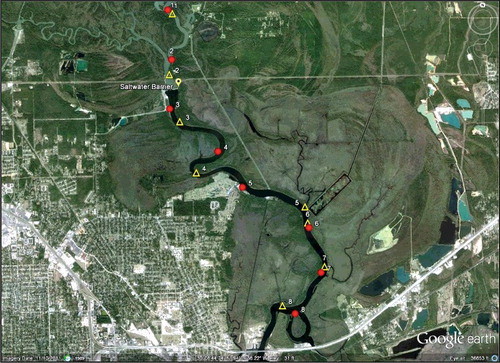
Table 1. Species % relative abundances for gillnet samples from the eight sites in the Neches River, Texas (F = freshwater, E = Estuarine, M = marine).
Table 2. Species % relative abundances for seine samples from the eight sites in the Neches River, Texas (F = predominantly freshwater, E = Estuarine, M = marine).
Figure 3. Hydrograph showing mean daily discharge in the Neches River during the study period (2012) and mean daily discharge for April–August based on 2002–2015 records. Data from United States Geological Survey gauge #08041780 (Beaumont Saltwater Barrier) are adjusted for tidal influence.
Table 3. Fish species richness and average catch-per-unit effort for gillnet and surveys at two sites located above the saltwater barrier on the Lower Neches River and six sites below the saltwater barrier during months when the barrier was either open or closed (CPUE for gillnet samples is no. of specimens/10 m/h based on a standard experimental gillnet; CPUE for seine samples is no. of specimens/m based on a standard seine).
Table 4. Percent relative abundance of freshwater versus estuarine plus marine fishes from gillnet and seine surveys conducted when the saltwater barrier on the Lower Neches River was open or closed and at sites above or below the barrier.
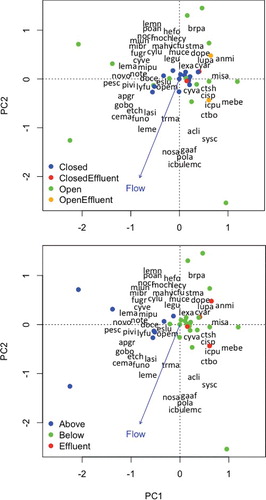
Figure 4. The first two axes from principal components analysis (PCA) of gillnet catch-per-unit effort (CPUE) data in the Neches River. Dots indicate locations of site surveys in ordination space. In the top plot, dot shades indicate whether the saltwater barrier was open or closed when samples were collected and near or distant from the MeadWestvaco paper mill effluent discharge; in the bottom plot, dot shades indicate whether samples were collected above the saltwater barrier, below the barrier and distant from the paper mill effluent discharge, or below the barrier and near the paper mill effluent discharge. Locations of text reveal species (text containing first two letters of the genus name and first two letters of the species name) loadings on each axis and correlations of environmental variable (text at vector tips) with each axis.
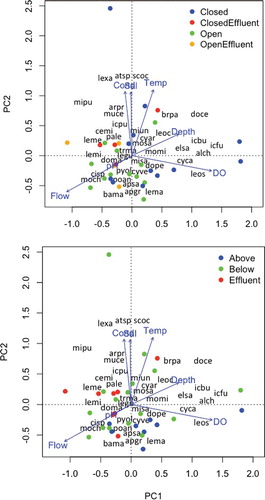
Figure 5. The first two axes from PCA of seine CPUE data in the Neches River. Dots indicate locations of site surveys in ordination space. In the top plot, dot shades indicate whether the saltwater barrier was open or closed when samples were collected and near or distant from the MeadWestvaco paper mill effluent discharge; in the bottom plot, dot shades indicate whether samples were collected above the saltwater barrier, below the barrier and distant from the paper mill effluent discharge, or below the barrier and near the paper mill effluent discharge. Locations of text reveal species (text containing first two letters of the genus name and first two letters of the species name) loadings on each axis and correlations of environmental variable (text at vector tips) with each axis.