Figures & data
Figure 1. Louisiana State University AgCenter Rice Research Station, Crowley, LA, USA (30o14′23.9″N, 92o20′44.0″W. Areas containing research plots are marked for 2013 and 2014. Detrital subsidy plots are gray, control plots are white.
Table 1. Arthropod taxa sampled from rice fields in 2013 and 2014 and their total abundance found in each year in both their manure and control plots. The differences in numbers of Collembola, Carabidae and Staphylinidae in 2013 and 2014 are attributable to differences in the resolution to which taxa were identified in 2013 and 2014.
Figure 2. Non-metric multidimensional scaling of sites in rice fields between detrital subsidy plots (▴) and no-treatment (•) plots at the LSU AgCenter Rice Research Station, Crowley, LA, USA in 2013 (a) and 2014 (b). Date and Plot (arrows) indicate that the date and the plot the sample was taken is a strong predictor of community composition.
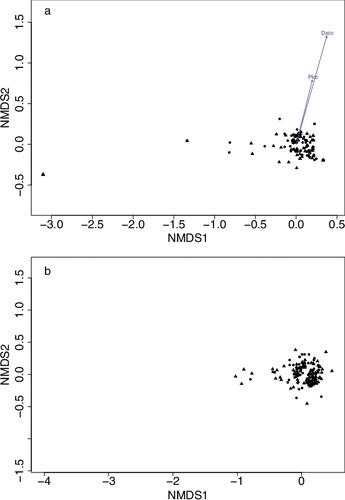
Figure 3. Sample based rarefaction curves for 2013 (a) and 2014 (b), comparing number of species expected to be found in a given number of samples in detrital subsidy and control plots. Note the difference in x- and y-axis scale.