Figures & data


Table 1. Food web parameters studied in the Cacín stream.
Figure 1. Maximum Shannon-Wiener index of diversity (), actual Shannon-Wiener index (H′) and evenness (E′) of the macroinvertebrate community in the Cacín stream throughout the study period.
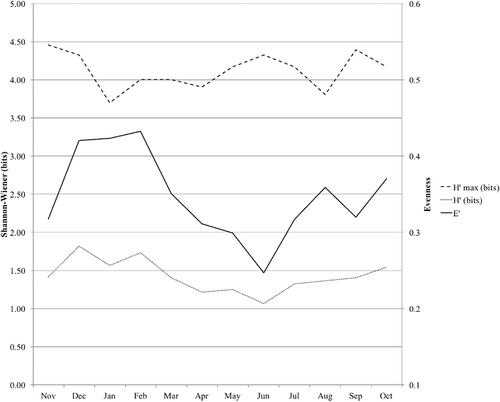
Table 2. Gut contents of each taxon present in the macroinvertebrate community of the Cacín stream.
Figure 2. Variation in the density of functional feeding groups throughout the study period in the Cacín stream.
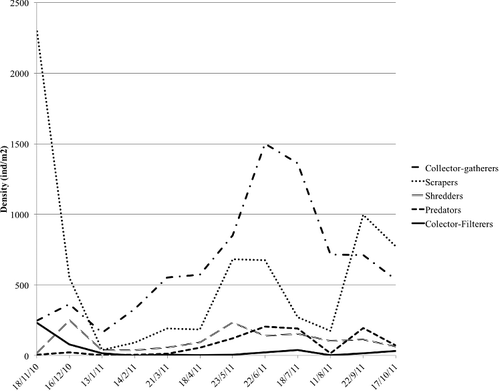
Table 3. Food web parameters analysed in the Cacín stream for each sampling date.
Figure 3. Graphical representation of the topology of the food webs of each sampling date in the Cacín stream.
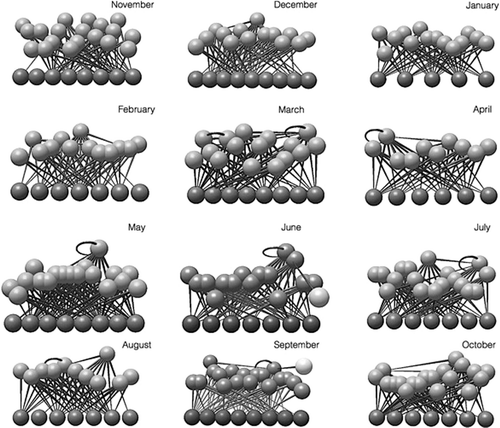
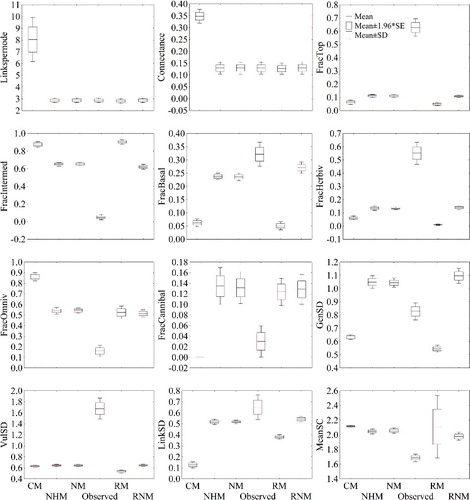
Figure 4. Graph showing the observed values of the analysed parameters of the food web in the Cacín stream each month, and values in each month calculated with each model under consideration. Bars represent mean values and whiskers represent upper and lower confidence intervals.
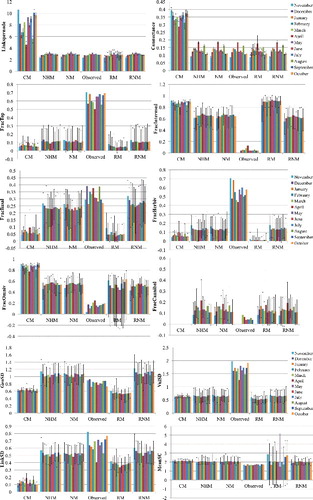
Figure 5. Empirical annual values of the analysed parameters of the food web (see Material and methods section for their explanation) in the Cacín stream and annual values calculated with the models under consideration.