Figures & data
Figure 1. Map of the Xin'an basin in the Anhui Province, China. Solid circles marked the 91 sampling sites.
Table 1. Summary statistic for predictor variables measured for local habitat, tributary spatial position, and catchment landscape condition.
Table 2. Species composition, the frequency of occurrence (F) and relative abundance (RA) for fishes collected in the headwater streams of the Xin'an basin.
Table 3. Effects of environmental factors on fish species richness based on stepwise linear regression.
Figure 2. Spatial variations of fish assemblage structures across stream orders based on non-metric multi-dimensional scaling.
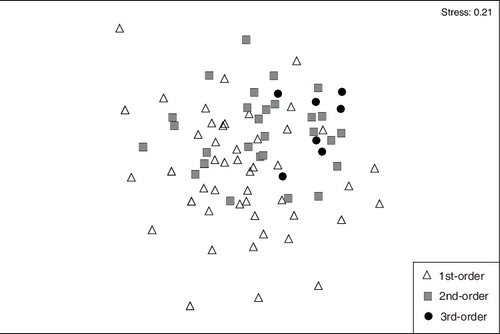
Figure 3. Redundancy analysis diagram for fish assemblage structures and significant environmental factors (a) local habitat; (b) tributary spatial position; (c) catchment landscape; (d) all environmental factors. Environmental variable and species codes as in and , respectively.