Figures & data
Figure 1. Light photomicrographs of strains of Oscillatoria sp. nov.
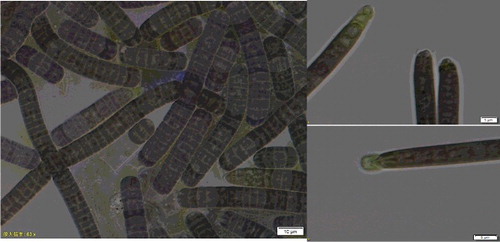
Table 1. Daphnia-algae feeding treatments. The ratio of unlabeled S. obliquus to labeled filaments was 1:10.
Figure 2. Growth of D. magna in each beaker, which fed by sole S. obliquus (S, as control), sole M. granulata (M1), M. granulata mixed with S. obliquus (M2), sole Oscillatoria sp. (O1) and Oscillatoria sp. mixed with S. obliquus (O2) during the 96-h experiment. Each symbol represents the mean value in the D. magna-algae feeding treatment, with the error bar representing the standard deviation.
Table 2. One-way ANOVA for the mean of growth rate (k) of the five different D. magna-algae feeding treatments.
Table 3. The results of LSD post hoc for comparing the mean of growth rate (k) of the five different D. magna-algae feeding treatments.
Table 4. One-way ANOVA for the mean of survival rate of the rest four different D. magna-algae feeding treatments.
Table 5. The results of LSD post hoc test for comparing the mean survival rate of the remaining four different D. magna-algae feeding treatments.
Table 6. Growth rate (k), final survival rate and catabolic tissue turnover rate (m) estimated for the five different D. magna-algae feeding treatments.
Table 7. Isotopic turnover modeling parameters estimated of the five different D. magna-algae feeding treatments.
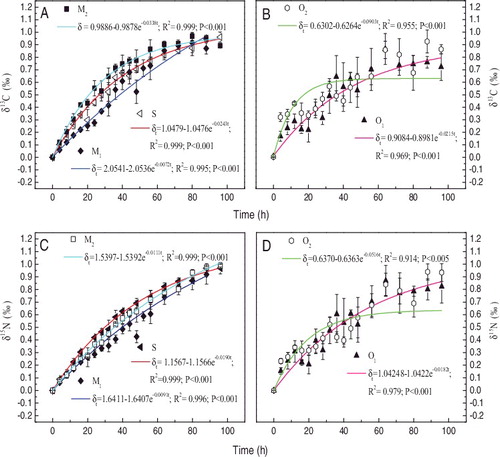
Figure 3. Changes in 13C and
15N values of D. magna fed by sole S. obliquus (S, as control), sole M. granulata (M1), M. granulata mixed with S. obliquus (M2), sole Oscillatoria sp. (O1) and Oscillatoria sp. mixed with S. obliquus (O2) during the 96-h experiment. Each symbol represents the mean value in the D. magna-algae feeding treatment, with the error bar representing the standard deviation.