
Figures & data
Figure 1. Meteorological characteristics (NASA-POWER Citation2016) driving the simulations at different latitudes: 07° 26′ N, 03° 53′ E (Nigeria) and 27° 30′ N, 80° 30′ W (USA). (A) Daily solar radiation (MJ m−2 day−1), (B) daily average air temperature (°C).
Table 1. Characteristics of sampling sites supporting Pistia stratiotes populations at different latitudes.
Figure 2. Simulated results (lines) and measured data (symbols; data from Sharma & Sridhar Citation1981) of the biomass and leaf area index (LAI) of Pistia stratiotes populations at 07° 26′ N, 03° 53′ E. Total biomass = shoots biomass + roots biomass.
Figure 3. Simulated results (lines) and measured data (symbols; data from DeWald & Lounibos Citation1990) of the biomass and leaf area index (LAI) of Pistia stratiotes populations at 27° 30′ N, 80° 30′ W. Total biomass = shoots biomass + roots biomass.
Table 2. The deviations of simulated results reproduced by Pistia-model from observed field data at different latitudes.
Figure 4. Production and seasonal fluxes of dry matter of Pistia stratiotes populations at 07° 26′ N, 03° 53′ E (Nigeria) constructed using simulated quantities. Production is expressed as g DM m−2 and fluxes expressed as g DM m−2 per year.
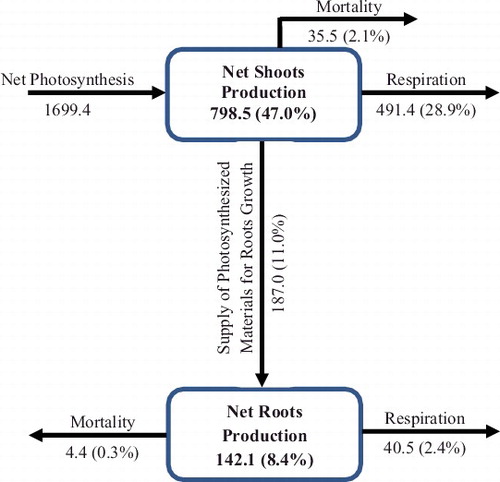
Figure 5. Production and seasonal fluxes of dry matter of Pistia stratiotes populations at 27° 30′ N, 80° 30′ W (USA) constructed using simulated quantities. Production is expressed as g DM m−2 and fluxes expressed as g DM m−2 per year.
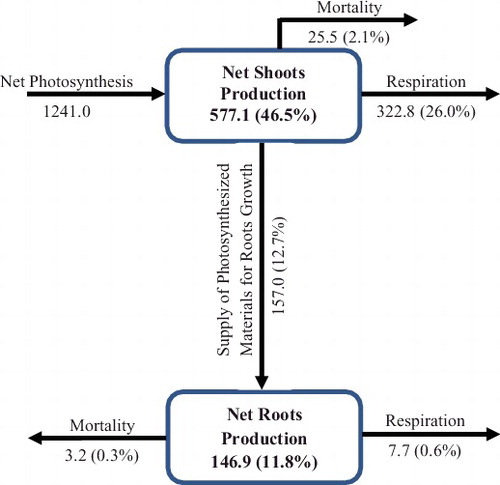
Figure 6. Daily solar radiation (MJ m−2 day−1) and daily average air temperature (°C) sums at 07° 26′ N, 03° 53′ E (Nigeria) and 27° 30′ N, 80° 30′ W (USA).
Table