Figures & data
Figure 1. Sketch of the sampling sites located in the eutrophic lake. The closed curves were isobaths (in centimeter), and the isobath interval is 100 cm.
Figure 2. Characteristics of the water samples. The error bars are the standard deviations calculated from three different samples which sampled in consecutive days of each month (May 20, 21 and 22; June 18, 19 and 20; July 29, 30 and 31).
Figure 3. The abundance of nirK, nirS and nosZ genes in different month. The error bars are the standard deviations calculated from three different samples which sampled in consecutive days of each month (May 20, 21 and 22; June 18, 19 and 20; July 29, 30 and 31).
Figure 4. The boxplots and the significant difference analysis which was based on the Alpha index Chao1 and ACE. **mean that there was an extremely significant difference with p < 0.01; *means that there was a significant difference with p < 0.05; no symbol means that there was no significant difference with values p > 0.05. The statistical test that was used to compare the indices is student's t test.
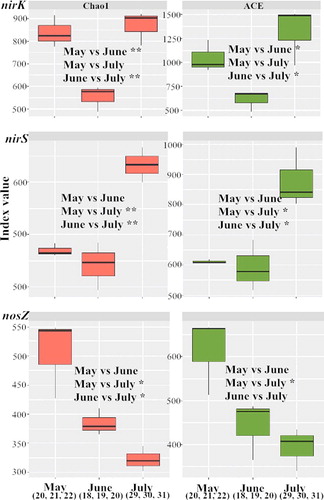
Figure 5. (a–c) Phylogenetic trees of the top 20 OTUs for nirK (5a), nirS (5b) and nosZ (5c) genes respectively. Bootstrap values (%) are shown on the nodes. The similarity values and the accession numbers of the reference sequences are in front of each OTU, which were indicated in parentheses.